Elections for Sale? Campaign Ad Spending in the USA and Arms Races

I. Some numbers

I read a series of letters to the Editor of The Globe and Mail this morning, all on the results of the US election, which continues to feature prominently in Canadian media, and certainly in the G&M. One letter-writer fumed that democracy had not triumphed in the recent US election, and went on to cite a number of reasons for believing that, including that ‘….the US Supreme Court has flooded US elections with corporate and special interest money.’

It seems to be a common belief among Canadians that because US elections involve the spending of so much more money than what is spent here in Canada on a federal election campaign, that winning elections in the US is all about outspending your opponent. That was certainly the attitude among the Canadians in the US Election discussion group I joined recently. A consequence of that need to outspend your opponent is the need to raise a lot of money, hence the belief that it is money, and those who have it, that matters to the outcome.

This prompted me to try to find out just how much was spent in this last US election, and by whom. The obvious place to go for such data is to the FEC, the US’s Federal Election Commission, as all spending by candidates, parties and political action committees (PACs) is supposed to be reported to this body. The FEC says that between Jan 1 of 2023 and Oct 31 of 2024, candidates for President and Congress spent $3.1B, the Party Committees together spent another $1.5B while PACs spent $7.3B, which adds up to just under $12B in total spending by all groups for US federal positions. That’s a lot of clams, and of course the good ol’ rule of 10 says that if Canadian spending is anything like in the same league, total spending in the next Canadian federal election (some time in 2025) will come to $US1.19B. Anyone care to bet it will be that high?

So far as I can tell, the FEC site doesn’t provide a breakdown of spending by party or candidate for the entire campaign. I found some tables that compiled spending up to June 30, 2024, but that ends well before the big spending spree just before Election Day. Which is not to say there isn’t a lot of info on the site. You can go in and find out that Nikki Haley for President, Inc, spent $49.58 on an Uber, date of the ‘disbursement’ being 12/31/2024, which is more than a month into the future, so…..I dunno what that means. Anyway, the site claims to have over 130 million records in its ‘disbursements’ database, all of which you can see, but I didn’t think I had the time to go through and add them up, and as a retiree I no longer have research assistants so I looked for another source.

A report from NBC news, dated Nov 8, reports on spending on advertising by the various parties and candidates, saying it is using data gathered by AdImpact. NBC reports that AdImpact reports as follows on the Presidential election:

“Overall, the Democratic campaign and pro-Democratic outside groups spent almost $1.8 billion, while the Trump campaign and pro-Republican outside groups spent $1.4 billion.”

So, the Dems outspent the Reps on this Presidential campaign by some $400million, and Harris lost. The story is similar in Congress, quoting again from the NBC story –

“The campaign for the Senate, which will be controlled by Republicans at the start of next year, drew about $2.6 billion in spending — $1.4 billion from Democratic candidates and outside groups and $1.2 billion from Republican candidates and pro-Republican groups.”

And……

“House races drew $1.7 billion in ad spending — $940 million from Democrats and $760 million from Republicans…”

It now appears the Republicans will have a slim majority in the House, also.

It leads me to wonder how evil all that money really is if it is not actually effective in winning elections. The Dems outspent the Reps on ads in all three cases, and lost. Of course, campaigns also spend on other things; the so-called ‘ground game’ of getting supporters to the polls, one way or the other. But I don’t think folks who worry about US elections being ‘bought’ worry about that. Helping folks get in their ballot is seen as virtuous spending, it’s all that ‘misinformation’ on TV and social media, financed by the evil rich, that is evil.

There is a substantial body of research showing that political contributions to Senators and Congressmen do not correlate with how they vote on legislation. That is, there seems to be no evidence that contributions from, say, the AFL-CIO or UAW to a legislator results in their voting more favourably on labour legislation, etc. One response to this is to note quite correctly that ‘no evidence’ does not mean that there is no effect. Finding good evidence that x has an effect on y, which is what most social science research tries to do, is difficult, and ‘no evidence found’ is a very common result of such research. (Research that finds ‘no evidence’ doesn’t often get published, which is why all you read about in the media are stories that include a sentence that starts ‘ a new study shows that….’. What those studies ‘show’ is very often baloney, but that’s a topic for another post.)

Another response to this particular ‘no evidence’ finding is that this is because what political contributions actually do is determine who ends up being elected to be a legislator in the first place. The 2024 election says maybe not so much, or at minimum, not always. The Dems outspent the Reps at every turn and ended up with a Republican president and Republican-controlled Congress. Their majorities in the latter are both very slim, and could be reversed in the 2026 mid-term elections, of course.

It will be interesting to see what happens in 2026. Who ends up controlling the House and Senate after those elections will be of interest, but also how the campaign fundraising and spending go. Will the Dems be able to again outspend the Reps, and will it get them control of Congress if they do?

Just for fun, I went back and checked on the last Canadian federal election in 2021, and discovered that the limits set by Elections Canada on spending by the various federal parties were set at $30Cmillion or less, depending on how many candidates each party ran, so that came to an overall ceiling of just under $150Cmillion in spending by all the federal parties combined. Canada doesn’t have PACs, but third parties do spend money in Canadian election campaigns. I could not find any figures for spending by such groups, but Canadian legislation prevents them from spending more than $150,000 in any one election, so their spending cannot add up to much, it would seem. In short, there is no way total campaign spending in the next Canadian federal election is going to get anywhere near $US1.19B, as that would translate into about $C1.6B.

Does that lower spending mean we get better electoral outcomes in Canada? What do you think? Electoral campaigns are certainly much shorter in Canada, a fact for which I know I am very grateful. But – would it be better or worse for all if parties and candidates were allowed to spend more? I’m betting no one reading this thinks it would be better….

II. A Hypothesis

One way to understand this high level of US campaign spending is to view it as an arms race, much like the one that Pepsi and Coke are involved in. That is, no one in North America can possibly be ignorant of the existence of, or the taste of, either Pepsi or Coke. Yet in 2019 Coca Cola spent $154million advertising just its Classic and Lite brands in the US, while PepsiCo spent $118million advertising just its Pepsi brand in the same year. Why so much for a product everyone already knows about? Answer: it’s an example of an arms race, like what happened in Europe before WWI.

The key characteristic for a strategic situation to be an arms race is that each party believes that it’s chance of winning is greater the greater is their own spending and the less is their opponents’ spending. Winning a war in 1914 was more likely the more a country spent on arms and the less its potential opponents spent. Check. The more Pepsi spends on advertising Pepsi the greater will be Pepsi’s sales, the more Coke spends on advertising, the less will be Pepsi’s sales, and conversely. Check. The more Trump spent on political ads, the more likely he was to win the election, but the more Harris spent the less likely he was to win, and conversely. Check. This all leads to each side in an arms race trying to outspend their opponent, and means that the more your opponent raises/spends, the more you feel you must raise and spend. Hence, ever-increasing fundraising and spending.

The logic of this all leads to the conclusion that both parties would be better off if a third party could come in and impose an outside limit on their spending. In the political case, that would mean a law limiting contributions or spending or both, such as Canada has. It is also the impetus, at least partially, for arms control agreements and treaties in the warfare example – although Hitler in the 30s showed that there is an enforcement problem with those. In the case of Coke and Pepsi, there is no third party, and if those companies sat down together and agreed to mutually limit their own ad spending, they would almost certainly get in trouble with US anti-trust authorities. That is illegal collusion, man.

A case in commerce where a third party did more or less impose an ad spending limit was in the early 70s, when cigarette ads were banned from TV by the US government.

This was done for health reasons, not to help out the tobacco companies, but I have heard that tobacco company stock prices rose after that ban, which would be outstanding proof they were in an arms race up until then. I haven’t been able to find any credible evidence of that rise – it happened back in 1970 – although it does seem to be true that overall industry spending on advertising dropped after the ban on TV ads. If anyone out there can point me at evidence about those tobacco stock prices, please do. I won’t hold my breath…..

Anyway, the analogy with political campaign advertising is pretty clear. There was no possibility that anyone in the US who might possibly vote was ignorant of the looming election or of either of the two candidates. The media provides unending streams of information about it all independently of any advertising by the two candidates and parties. Do all those campaign ads induce people to vote who otherwise would not, or is each campaign just worried about losing vote share to the other side if they don’t advertise? If so, then maybe Canada’s campaign spending limits regime is superior – at least for the political parties, and maybe for the voters. No one claims that the media were made better off by that 1970s TV advertising ban on cigarettes.

An attempt to limit campaign spending in the US would likely not get past the first amendment, but I’m betting the media would be at the front lines of trying to stop any such effort in any case. To them, after all, that $12B is revenue.

Gonna Get Geeky – and Long

Hey, let’s not think about the recent US election for a bit, ok? I want to write about something much more exciting – economics!! Even better – debt!!

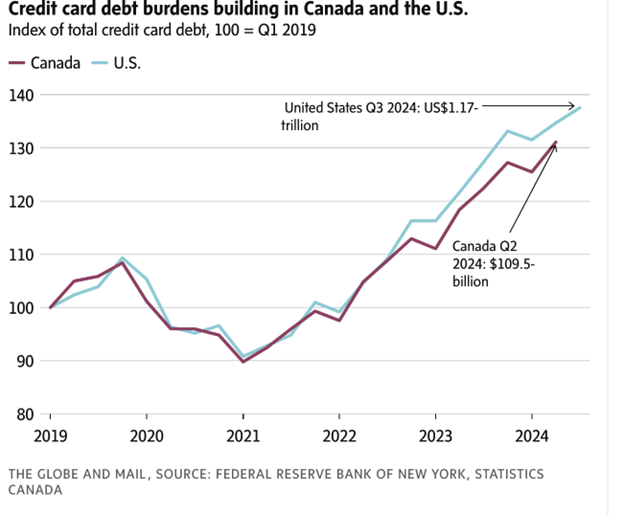
Writing about government debt immediately tends to get pretty political, so I’m going to write about something less political, I hope – consumer credit card debt. This was prompted by a brief story in the Globe on Saturday that led off with the graph below. It shows what has happened to credit card balances in both the US and Canada since 2019, indicating that they are 30%+ higher this year than they were in 2019.

I will note, as a minor aside, that the good ol’ rule of 10 holds here, once again. That is, that since the US has about 10 times Canada’s population, most national statistics in the US are 10 times bigger than in Canada. Here, it holds for the actual amount of recent credit card debt: $1.17trillion in the US to $109.5billion in Canada (I’m assuming here the Canadian number has been translated into US dollars, otherwise the Rule of 10 is rather in doubt.)

The US numbers come from a recent report by the New York Fed , and you can read the entire report here – https://www.newyorkfed.org/microeconomics/hhdc

It’s a vast and fascinating (if you’re a geek) cornucopia of charts and graphs, which is useful, because the commentary by readers attached to the Globe article raises a number of questions that do seem important. The theme of the article itself is that the chart above indicates that the US economy, or more accurately, the typical US consumer, whoever that is, is not in such great shape. However, various commenters point out that this one statistic doesn’t tell us much about that, we need to know some other numbers, like how consumer debt compares to consumer income over time, as well as what proportion of these credit card balances are earning interest. That is, is most of this representing balances that are paid off each month, or are they balances that are being carried month to month and thus drawing interest at over 20% per year? Also, are the charges that make up these balances payments for basics like groceries and utilities, or are they for ‘discretionary’ expenditures?

Even more critically, how much of this debt is in delinquency, representing cc balances on which required payments are not being made?

First, a chart on p.3 of the Fed report (which is actually several pages into the report itself) consists of a chart that shows the proportion of total consumer debt in the US of all forms, and this makes it clear that cc debt is pretty tiny. The single biggest source of consumer debt is in mortgages, which made up 70% of consumer debt in 2024Q3. This was followed by student loans and auto loans, each making up only 9% of the total, and cc debt being only 6%. (A later graph shows that there are many more cc accounts than mortgages, some 600million versus only 80million mortgages, but of course the mortgages are for much larger amounts. That 600million number  also tells us that most folks have more than one credit card, btw.)

Now, one might say that cc debt is what moves around the quickest in response to changing economic conditions, and so is still important as the proverbial canary in the coal mine, even if it is a small part of overall debt. Fair enough, so what is going on over time with cc debt in the US?

One interesting stat, make of it what you will, is that while cc balances in 2024 in the US were indeed just over a trillion dollars, credit card limits were over 5 trillion dollars, so on average, people carry balances that are only 20% of their credit limit. In addition, the same chart shows that credit limits have increased much more than credit card balances over the last two or three years. Both those things seem like an indication that not many consumers are running up balances to their limits, but of course they could also simply indicate that issuers are very willing to increase credit card limits when asked.

What would seem a very clear indicator of consumer distress is the percentage of cc accounts that are delinquent, with payments being 30, 60, or up to 120+ days late. The Fed report tracks this, too, and it shows (p. 11) that overall delinquencies of all lengths hit a high of 12% of accounts in 2010, right after the financial crisis. No surprise there. Since then, the delinquency rates have all trended down nicely, hitting a low of around 3% sometime last year. The percentages have been ticking upward slightly since then, hitting a total of just under 4% being in some level of delinquency in Q3 of 2024. Not a good recent trend, but maybe not yet alarming.

Looking across categories of debt, a graph on p. 12 shows that the rate of loans being 90+ days delinquent has continued to trend downward for mortgages, revolving debt, and student loans. That last has crashed since 2021, no doubt due to Joltin’ Joe Biden’s ongoing attempts to forgive many student loans. Only auto loans and credit cards have seen a recent uptick in their delinquency rates.

Some final general stats to finish up the US story. Foreclosures and bankruptcies hit long-time lows in about 2022, and have been ticking up very very slowly since then (p. 17), and although the percent of cc accounts in third party collection (a very bad place to be) has declined a lot since 2016, and continues to do so, the amount in collection per account in collection has jumped up precipitously. So fewer cc accounts are in collection, but the amount those accounts are in arears appears to have increased by some 40% since late in 2022. I don’t honestly know what to attribute that to.

Now, it would be useful to compare all this to what is happening in Canada, and as usual comparable stats are much harder to find here. Say what you will about the US, they devote a lot more resources to producing useful stats about themselves than do we. Almost the only org in Canada that does that sort of thing is StatsCan. What follows is some useful, if not directly comparable data from that source.

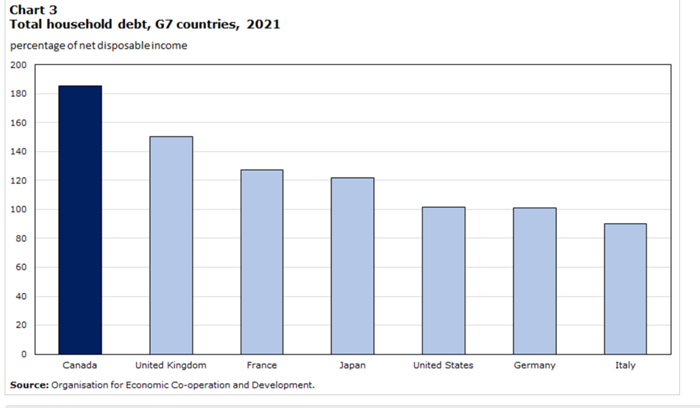
First, and I admit this surprised me, Canada has the highest ratio of consumer debt to disposable income among the rich G7 countries, as shown below:

Just as surprising to me is that Italy has the lowest ratio. Hmmm…..

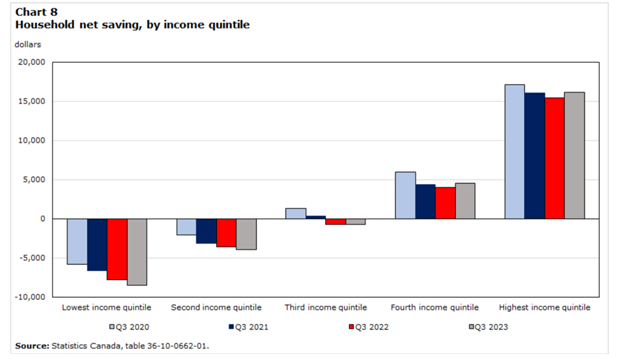
Some of the commenters on the original G&M article point out, quite correctly, that the numbers on that first chart are national averages, and so say nothing about the possibility that some segments of the population might be in particular trouble on the debt front. This is of course likely to be those at the bottom of the income distribution, and that very sensible point can be made about every US statistic I quote above. Below is a disaggregated stat that speaks directly to that issue for Canada, again from StatsCan.

Even in 2020, when the folks at the bottom of the income distribution were getting reasonably big pandemic transfers from the Canadian government, they were on average spending more than they earned. (To be honest, I cannot tell if this table’s figures include those government transfers as part of income. I’ve tried….) Moreover, the trend has been negative for those in the bottom three income quintiles since the pandemic. That is, their net saving has decreased – become even more negative – from 2020 to 2023. Only for the top two income quintiles has net saving been positive throughout this period, although it has fallen slightly since 2020 even for the fourth and fifth quintiles.

That says that overall, the folks in the bottom three quintiles have been borrowing (or drawing down any savings they had) more, and those in the top quintiles have been saving less. That doesn’t say ‘healthy consumers’ however you slice it.

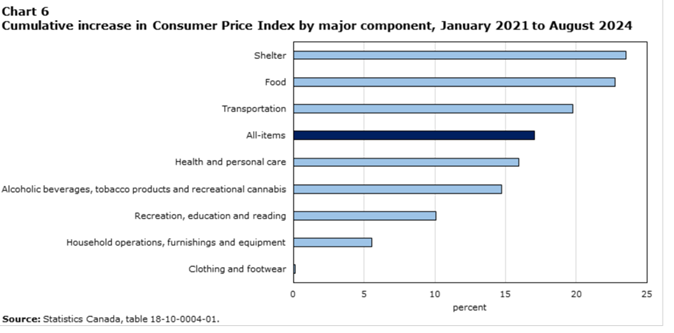
A final Canadian graphic from StatsCan which says a lot, I think:

Note that this is a graph of the cumulative increase in prices of goods and services in selected components of the CPI from ’21 to ‘24. What it shows is that the three components in which prices went up the most in that three-year-plus period were shelter, food and transportation, three things that everybody spends on. However, it is beyond doubt that those at the bottom of the income distribution spend a greater proportion of their disposable incomes on these three things than do those at the top.

Nothing healthy about that, either, particularly for those at the bottom. If one really (still) wonders at the reason for the unpopularity of the federal Liberals and their glorious leader these days, maybe the key is right there.


Not Political  

Hey, Kids!

This is going to be an article about the recent US election that is not about politics. I’m sure you’re all relieved – I know I am.

One staple of any US (or Canadian) election is pre-election polling. Media organizations do it, the parties and candidates do it if they can afford it, and movements in those polls are written about endlessly in the months leading up to the election. It might even be true that they matter for the outcome, because they affect people’s beliefs about the eventual likely outcome, and there is credible evidence that the expected closeness of an election affects people’s decisions to vote. Why bother if you expect a landslide?

This last US election was predicted by almost all polls to be close at every moment, but there were differences, and one notable difference was in the predictions made by traditional polls relative to those made by prediction markets. These market platforms, like Polymarket, allow people to make real-money bets on who will win the election. The price of betting on a Trump win is set on this market platform, based on what bets are being made, and varies between .01$ and 1$. Paying the going price at any moment gives you one ‘share’ in a Trump victory, which means that if he wins, as he did, you collect $1 for each share you bought. Similarly for shares in Harris, which trades on its own separate market (although prices on the two markets are obviously linked). Thus, if a share in Trump costs 40cents, that suggests that in this market the general belief is that Trump is more likely to lose than win, while if his shares are going for 65cents, as they were at various times a week or so before the election on Polymarket, that suggests the general view is that he is more likely to win. Those who bought Trump shares when the price hit $0.65 (see below) made $0.35 for each share they bought.

Polls, on the other hand, do not directly predict the winner, but rather try to predict the share of votes each candidate will get, both nationally and in each state, based on surveys of likely voters. Those state vote predictions then have implications for the Electoral College vote count, which can of course be used to generate a prediction about who will win.

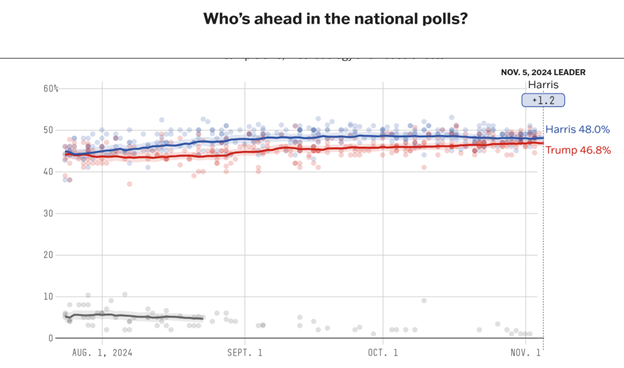
Below is the plaform Fivethirtyeight‘s final poll from Election Day.

Well, here are some facts (so far as I can tell) about all these predictions and polls in this election.

1, All the polls I know about got the national popular vote wrong. Not by a lot, maybe, but the ones that I know about predicted that however the Electoral College turned out, Harris would win the popular vote. They’re still counting votes in California for some reason, but it looks like Trump’s national vote total will exceed Harris’s by maybe 3 or 4 million.

2. None of the polls I saw at any point predicted that Trump would sweep the swing states of Pennsylvania, Michigan, Georgia, Nevada and Wisconsin.

3. If this makes you want to thumb your nose at polls generally, you should probably pick on the one that appears in – wait for it – The Economist. On Election Day – yes, you read that right – it posted an update to its prediction about the winner, giving Harris a 56 percent probability of victory.

Gonna be hard to live that one down……

4, There is plenty of chatter out there in the mainstream media now that the polls, like those in The Economist, are done for, having had their collective asses kicked by the political betting markets. That’s unwarranted, for sure. If you want to go full geek you can read a blog post here by statistician Andrew Gelman as to why that is an unwarranted conclusion, but know that Gelman was involved in putting together the prediction model used by The Economist. (I don’t believe he is involved in its day-to-day operation, so is likely innocent of any involvement in that big Harris jump on Election Day.)

However, I think I will back Gelman on this. First of all, it is worth noting that the betting markets back in 2016 were predicting a Clinton victory right up to election night, by which I mean a Clinton share cost more than $0.50 and a Trump share cost less than that. Beyond that, it is important to note that all US presidential elections in this century have been quite close, some of them really really close. It has become a 50/50 country at the national level politically, so predicting election outcomes is always going to be done with a great deal of uncertainty. That’s what makes sporting contests between equally capable teams fun, right? Whether that fun translates into politics you can judge for yourself.

All of which brings me to one particular prediction market in which something a bit unusual happened this year. I think it’s an interesting story in its own right. A couple of weeks before the election, the prediction market Polymarket, which had been selling Trump and Harris shares for prices not far from $0.50 for some time, suddenly saw the price of a Trump share vault into the middle 0.60s.

It turned out, and Polymarket was pretty up front about this, that the price had increased so markedly because a large buyer – later know as ‘The Trump Whale’ – had jumped in and bought a lot, as in millions of dollars worth, of Trump shares. It’s called a market because that’s what it is, that’s how it’s designed, so his big buy pushed the price of a Trump share up markedly.

It is still not known who this is, and Polymarket sure isn’t going to say, but The Wall Street Journal has featured a couple of stories on him, in which he has said he has no political agenda, but rather that he had a ‘hunch’ that Trump was going to win, that the polls were missing something. [It appears now to be common knowledge that he is a wealthy Frenchman who goes by the alias ‘Theo’. The WSJ claims he is set to rake in some $50 million from his election bets.] He bet not only that Trump would win the presidency, but also that he would win the national popular vote, something no poll got right.

The latest version of his story is that he believed that the polls were once again missing a ‘shy-Trump-voter’ effect, as they did in 2016 and 2020. That is, people who are going to vote for Trump, but won’t tell a pollster that, or just don’t respond to polls.  The WSJ story continues as follows –

To solve this problem, Théo argued that pollsters should use what are known as neighbor polls that ask respondents which candidates they expect their neighbors to support. The idea is that people might not want to reveal their own preferences, but will indirectly reveal them when asked to guess who their neighbors plan to vote for.

Théo cited a handful of publicly released polls conducted in September using the neighbor method alongside the traditional method. These polls showed Harris’s support was several percentage points lower when respondents were asked who their neighbors would vote for, compared with the result that came from directly asking which candidate they supported.

Well, now – that’s an interesting idea. If you think so, too, Gelman has an entire post devoted to it, not completely geeky, but very long, which you can read here. Bottom line: he also thinks ‘ask about your neighbors’ polling is an interesting (although not entirely new) idea, but needs more research. Of course he does, Gelman’s an academic, remember.

It is by now well-recognized by pollsters themselves that getting truly representative samples of people to survey has become more difficult with the demise of the universal use of landline telephones. What that all means for the polling business going forward remains to be seen, for sure, but it seems at least true that after three Trump-involved elections, US pollsters have still not figured out how to stop underestimating his support.


I Can’t Stop Myself

…..writing about the US election. There’s just so much silliness.

Sometimes the best thing I can do in this blog is point my readers to other sources at which they can find things really really worth reading. One such is The Free Press https://www.thefp.com/  a website founded by former NYTimes staffer Bari Weiss. I subscribe, but you can read much of its content for free, and it consistently features commentary that I find both educational and stimulating. And, best of all, at least from my perspective, it is not just a mindless conservative/right-wing/Republican mouthpiece. In the long article that I quote below the author spends two paragraphs explaining how the Republicans’ likely control of both the executive and legislative branches of the US Federal government is not going to be a good thing and then explains what a fool is Tucker Carlson.

I quote below from a weekly Free Press column titled TGIF, written by Nellie Bowles . You should go here to read the entire thing, it is quite long but almost uniformly awesome. I am repeating here just what she writes about how the leftish US media intelligentsia is writing about Harris’s loss to Trump.

→ Our campaign was perfect: In the wake of their staggering defeat, Democrats have figured out what went wrong. It’s simple: The voters are bad. Americans are bigots. Case closed.

“I mean, this really was a historic, flawlessly run campaign,” said MSNBC’s Joy Reid. “She had—Queen Latifah never endorses anyone. She came out and endorsed her. You know, I mean, she had every prominent celebrity voice. She had the Taylor Swift—she had the Swifties, she had the Beyhive. You could not have run a better campaign in that short period of time.”

You’re telling me Queen Latifah didn’t move the needle for Kamala? I need to sit down.

Or there’s Emma Vigeland, a host of the influential progressive radio show Majority Report, who said: “Can’t believe I actually had faith in other white women to choose our collective reproductive rights over their own whiteness. Naive and dumb.”

B-b-b-but, the Swifties are white!

Here’s Washington Post associate editor Jonathan Capehart on PBS: “I can’t help but wonder if the American people have given up on democracy.” USA Today columnist Michael Stern slammed a piece that dared ask the question of where Harris went wrong: “Nope, I won’t read it. Harris ran a great campaign. The story should be titled ‘where the American people went wrong.’ ”

Frankly, the American people should have had to earn Kamala’s vote.

How, one might ask, could voters fail such a simple test? As Reid summed it up: “One side stands for freedom while the other meets the textbook definition of fascism: namely, a far-right dictatorial regime like Hitler’s Germany or Franco’s Spain or Mussolini’s Italy. But also, white-ruled South Africa before Mandela and the black majority took control. Or Vladimir Putin’s Russia, Viktor Orbán’s Hungary, or Nicolás Maduro in Venezuela today.”

All of those places in one, that’s America today. They took Hitler’s Germany, Franco’s Spain, Mussolini’s Italy, and apartheid South Africa and rolled them all up into a dictator burrito and ate it for breakfast. They saw Putin’s Russia and said I’ll take three, thanks. Americans drained the swamp and then reconstituted it with Orbán’s Hungary. That’s what voters did.

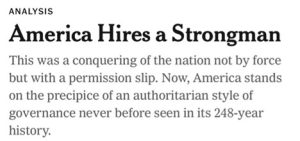
You might take all of these shifts and think: Wow, American voters rejected Democrats in this cycle. Or you could have The New York Times’ take on it, which is that we have been conquered.

Never before seen in our 248-year history? He was president four years ago.

As I often write: you can’t make this shit up. There’s plenty more in the article worth reading, including where Bowles notes that Instagram took down a post by Piers Morgan (remember him?) in which he congratulates Trump for his win, the Instagram nannies having determined the post constituted ‘hate speech’.  https://twitter.com/piersmorgan/status/1854273724327059936

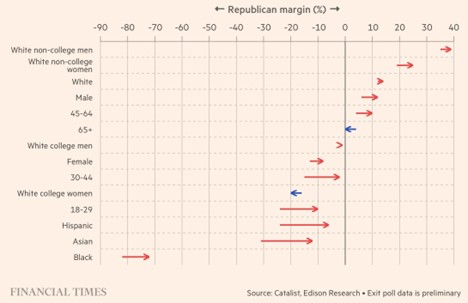
A parting shot. The exit poll info below was also in the article, but is in fact originally from The Financial Times. It shows, subject to the usual caveats about exit polling, how all-encompassing was the vote shift away from the Democrats relative to 2020.

Can’t make that up either, Dems.

Post-Apocalypse Post

I may or may not post more on the just-completed US federal election in the future, but here on the day after I want to write a few things that occurred to me today or in the course of the campaign.

1. Mainstream Media. A couple of months ago, just after Harris magically became the Democratic nominee, I was sitting in my living room writing a blog post, as I do. I was also listening to the CBC’s Tempo program, in which CBC plays classical music from 9am to noon. Tempo also features a four-minute newscast at the top of each hour. CBC thought a good use of some of that four minutes was to inform me every hour that Taylor Swift had endorsed Kamala Harris for president. My tax dollars at work.

2. Charlatans. Every US Presidential election season, shallow media outlets like the New York Times and NPR drag out historian Alan Lichtman, proclaiming him as ‘The Prophet of Presidential Elections’. If you want to know why this moniker is balderdash, you can read statistician Andrew Gelman’s blog articles about it here and here. One can hope that Lichtman won’t get the usual media coverage in four years, given he predicted a Harris win this time – but I would not bet on it.

3. Snowflakes. In the run-up to said election, it appears that the School of Public Policy at Georgetown University felt that their students were so stressed by this looming election that special services had to be set up for them. You can read about it all here, but to give you the idea, here’s a brief quote from the article, written by Free Press (No, not the London one) columnist Frannie Block:

Here’s the agenda (and no, you can’t make this up):

10:00 a.m.-11:00 a.m.: Tea, Cocoa, and Self-Care

11:00 a.m.-12:00 p.m.: Legos Station

12:00 p.m.-1:00 p.m.: Healthy Treats and Healthy Habits

1:00 p.m.-2:00 p.m.: Coloring and Mindfulness Exercises

2:00 p.m.-3:00 p.m.: Milk and Cookies

4:00 p.m.-5:00 p.m.: Legos and Coloring

5:00 p.m.-6:00 p.m.: Snacks and Self-Guided Meditation

I wanted to ask Clevenger [the school’s director of student engagement’] why college and graduate students needed milk and cookies to recover from their stressand how being coddled in college might someday affect American diplomacy—but she didn’t respond to my calls or emails.

I am very much looking forward to reading about what Georgetown are doing for their students now to help them deal with an election win by The Anti-Christ. Stay tuned for updates.

4. Apocalypse. To finish up, I quote here a paragraph from the article by Andrew Coyne that appeared in today’s Globe and Mail. I plan to save the entire article for future reference, but I am posting this much here so we can all revisit Andrew’s predictions in a few months.

“There is no sense in understating the depth of the disaster. This is a crisis like no other in our lifetimes. The government of the United States has been delivered into the hands of a gangster, whose sole purpose in running, besides staying out of jail, is to seek revenge on his enemies. The damage Donald Trump and his nihilist cronies can do – to America, but also to its democratic allies, and to the peace and security of the world – is incalculable. We are living in the time of Nero.”

Yikes. Gotta find my Lego set.


Just Don’t Say It

I read a story in the Sept 27 print segment of the National Post that comes inserted into my London FreePress that had an odd headline. Well, it was odd if you think it was supposed to be a news story.

“Survivors….deserve to heal.”

The first sentence of the story:

“An NDP MP tabled a bill Thursday seeking to change the Criminal Code to criminalize downplaying, denying or condoning the harms of residential schools in Canada.”

The bill is C-413, a private members bill, and the article goes on to note that such bills ‘rarely pass’ but does not specify what ‘rarely’ means, numerically. Not ‘never’, I would guess.

The article goes on to note that  ‘…several years earlier the Liberal government passed an amendment to its 2022 budget implementation bill that added a criminal provision against making public statements that promote antisemitism “by condoning, denying or downplaying the Holocaust’.”

That got me thinking, and remembering, and that got me digging, which is why this post is just being put on the blog now.

I remember Trudeau’s government doing that, and remember thinking at the time that it was a terrible idea, and I also remember that more than one Jewish organization lobbied against including that in the budget bill at the time. (Other Jewish organizations supported it, to be sure.)

My reasons for being distressed back then at this clearly non-budgetary matter being passed into law is precisely captured by this recent private member’s bill. Once you establish the precedent of passing laws criminalizing what people say or write about any public matter, there is no going back. It just becomes a matter of what things people say might catch the disapproving notice of some MP or – more alarmingly – some government.

Since I don’t trust 21st century media to report facts accurately, I went to the Parliamentary website to find the exact text of this bill.

That text includes the following:

2.2) Everyone who, by communicating statements, other than in private conversation, wilfully promotes hatred against Indigenous peoples by condoning, denying, downplaying or justifying the Indian residential school system in Canada or by misrepresenting facts relating to it

(a) is guilty of an indictable offence and liable to imprisonment for a term not exceeding two years; or

(b) is guilty of an offence punishable on summary conviction.

The bill also states what can be a defense against this charge. It states:

Defences — subsection (2.2)

(3.2) No person shall be convicted of an offence under subsection (2.2)

(a) if they establish that the statements communicated were true;

(b) if, in good faith, they expressed or attempted to establish by an argument an opinion on a religious subject or an opinion based on a belief in a religious text;

(c) if the statements were relevant to any subject of public interest, the discussion of which was for the public benefit, and if on reasonable grounds they believed them to be true; or

(d) if, in good faith, they intended to point out, for the purpose of removal, matters producing or tending to produce feelings of hatred toward Indigenous peoples.

Confining myself to (a), note that this states that ‘truth’ is a defense against being convicted of this new crime, but it also is written to say that ‘they’ – the person charged with the offence – has to establish that the statements communicated were true. So, I will start by noting that this shifts the burden of proof from where it usually resides – with the prosecution – to the defendant.

Beyond that not-small matter, let me offer a hypothetical example of how a case brought under this new criminal statute, were it to be enacted, could go. Suppose I write to a First Nations leader, or a member of parliament, and ask the following question – or I just post this question on my blog:

“In how many of the claimed residential school gravesites have verified human remains actually been found?”

I have no doubt that my doing this would generate outrage in many circles. The question is, would it subject me to arrest and prosecution if this bill were to pass?

Note that I have asked a question in this scenario, but a question which might be interpreted by some as an attempt at ‘downplaying the Indian residential school system in Canada’.

And there is no statement whose truth could be verified so as to defend myself if I were arrested. I would be asking a question. Questions are not true or false, they are….questions.

Suppose I wrote in my blog that ‘Surely the residential school system benefited many of the children in it in many ways. Nothing is all bad or all good.’

Again, no facts to be verified, just a statement about how the world generally seems to me to work. Am I subject to prosecution, and if I am prosecuted, how might my lawyers defend me?

There are other reasons for being worried about this ‘truth as a defense’ aspect of the bill.

You can read a related story here on the Vancouver is Awesome website. I confess to being unaware of this site until recently, and I deplore the fact that it does not put actual dates on its stories (‘one day ago’ is not a date).

However, it chronicles an argument at the annual meeting of the Law Society of BC about the language to be used in a training program. Two members of the society put forward a motion questioning the language used because to date no human remains had been found at the Kamloops Residential School site. All that had been established was the existence of ground radar ‘anomalies’, a fact which the First Nation had acknowledged by changing the word ‘remains’ to ‘anomalies’ on its own website.

Other lawyers argued passionately against changing the language in the training course. One of them, described as ‘family lawyer Andrea Glen’, is quoted as follows:

“So in light of this significant body of evidence across the country, to quibble over the language of whether something is a burial site at a particular location, or a possible burial site or a probable burial site, obviously completely misses the point, and it’s just so hurtful to quibble over the language used for one particular area when we have a huge body of evidence that this happened across the country,” said Glen.

So, would lawyer Glen then say that, since there is ‘a significant body of evidence that non-indigenous individuals murder indigenous people across the country’ one should not in a particular trial be able to question whether non-indigenous person John Brown actually murdered indigenous person Joseph Alsop, as stipulated in the indictment?

Another lawyer and Society member, Adrienne Smith, is quoted as follows:

Smith added that Heller and Berry’s resolution is “part of a distressing trend in courts to try to inappropriately put a referendum about the needs of equity-denied groups improperly before courts and tribunals.”

Given the chance, I would say to Ms Smith that the resolution seems to me to be an attempt to put a question about certain facts before your society. It is not about anybody’s needs. But this is part of my concern. The law is increasingly concerned with what certain groups ‘deserve’, to quote the article’s headline, or what they ‘need’, as Ms Smith puts it. Not facts, not truth.

Given that, I am exceedingly dubious regarding the idea that Canadian lawyers, a group which, keep in mind, includes Canadian judges, all of whom are lawyers, will give any serious consideration to the question of ‘truth’ in any trial that arises from Bill C-413 if it becomes law. Why would it not be, as 21st century language often puts it, the ‘lived truth of Indigenous Peoples’, or at least the court’s interpretation of that truth, which would rule the day in most Canadian courtrooms in which a case brought under Bill C-413 was brought? It is increasingly common today to assert that everyone has their own truth. If my truth about residential schools in Canada conflicts with the truth of some Indigenous person, whose ‘truth’ will the court use in determining whether I have a valid defense against a charge of violating the terms of Bill C-413?

To put it simply, I doubt that the ‘truth’ defense will actually be any defense at all.  And, if truth is not a defense, Bill C-413 becomes a device for shutting certain people up, and thereby for stopping any meaningful discussion of residential schools. The law of the land should never serve that purpose in a free society. Never.

I see other issues here. The bill includes the qualification ‘other than in private conversation’. So, if I say something like ‘the residential schools weren’t all bad’  while talking to a friend in a pub, and someone overhears me – is that private conversation? Could a constable who overheard me say that, or a constable who took a sworn statement from someone that I did say that, arrest me for violating C-413?

I would bet they can, by the same legal logic that allows governments at all levels to pass laws that regulate so much of what happens in that pub.

It is by such devices that we get closer to the old Soviet dictum – ‘You can think anything you want, just don’t say it.’

‘Slippery slopes’ are not taken seriously these days, I know. However, Bill C-413 seems to me like a second step on such a slope, following on the first step that was included in the Liberal budget implementation bill of 2022. Bill C-413 will almost certainly not end up as law, if for no other reason than that the Liberal government is on its last legs. But some day, not too far off, I do fear that some government will take step two, about whatever statements it finds objectionable. Then, inevitably, the steps get closer together once you get moving along the slippery slope.


Bought and Paid For – and Scared

I open with a tip of my hat to Andrew Coyne, whose op-ed piece in the Oct 4 Globe, titled ‘Nice little news network you got there. Pity if anything should happen to it’ inspired this post. [I will add – that’s a good headline for the article, not something I say often.]

A word about Coyne. I have been reading him since he was The National Post’s token liberal commentator, and continue to do so now that he is the Globe’s token conservative. I also watch him on CBC’s At Issue panel on Thursdays, but in truth I watch that mostly to hear what the redoubtable Chantal Hebert has to say about Canadian politics. Chantal is awesome.

Andrew has a few things that he write about regularly, from which I infer they matter to him a lot. Here are three of them, which I’m bothering to list here because they matter to me, also.

  1. First-past-the-post (otherwise known as plurality rule) electoral systems, as are used in Canada, England and in US congressional elections, are bad, and should be replaced by proportional representation systems.
  2. Much of what is wrong with current Canadian politics and governments arises because it is now necessary to have the approval of the Party leader to be nominated to run in any riding as the candidate for that Party.
  3. It was wrong and will lead to a diminishment of Canadian democracy for the federal government to set up a system for subsidizing (selected) news media outlets.

Full disclosure – I disagree completely with Mr Coyne about issue 1, but agree with him almost entirely with regard to issues 2 and 3. I am going to say nothing here about 1, it is a complex subject, one I spent a good bit of my professional career thinking and teaching about. Someday I may write a long post or three about it, but not now.

I agree with Coyne about 2, and I will at this point say only this about it. If you wonder why MPs from the Liberal Party of Canada did not long ago force their highly unpopular PM and party leader to step down, you have only to note issue 2. Those MPs rely on the leader of the party to sign off on their nomination if they are to have even the chance to run for office in their riding in the next election. They are not about to piss JT off. I say no more at this point, even though there is much more to be said.

On to 3, the topic of this post. To his credit, from the moment the idea of having ‘approved’ news media organizations receive financial subsidies from the federal government was suggested, Coyne has written piece after piece saying ‘this is a terrible idea’. The press cannot, must not, be seen to be in the debt of the federal government if they are to play their role of holding government ministers and bureaucrats accountable for their decisions. Full Stop.

That argument is unassailably correct, as far as I am concerned, but of course those subsidies are now in place anyway. The first big problem with this system is  – which orgs get such a subsidy and how much does each get? That the CBC gets a subsidy in the current regime, on top of the more than $1Billion they get directly from taxpayers, should tell you immediately that the subsidy-receivers are going to be tilted toward BIG establishment news outlets. According to CTV news (a CBC competitor, to be sure), CBC got $1.4B in the most recent federal budget, an increase of about $90million from the year before. How much of this is the ongoing subsidy they receive every year and how much is from this new, broader subsidy regime, is not clear.

Coyne’s Oct 10 piece above simply points out two more emerging consequences of the existence of this subsidy regime. One is Pierre Poilevre’s recent attack on CTV News, which included forbidding Conservative MPs from speaking to reporters from that org. He did this in response to two CTV employees splicing together some video of Poilevre so as to make him seem to say something he did not actually say.

I agree with Coyne that what those CTV employees did was flat out wrong, but Coyne’s point is that CTV was over-the-top apologetic about it, issuing two separate apologies, firing the two employees, and that CTV did that – in Coyne’s view – because they know they have pissed off a likely future PM, who is going to soon be in a position to influence their subsidy.

The larger point is: how can news org’s claim to be ‘independent watchdogs’ of the government  of the day – you know, the vaunted ‘fourth estate’ – while receiving a subsidy from that government? Coyne goes on to say that political abuse of the system is already a bi-partisan matter, citing a tweet on X in which a Liberal MP says to a National Post reporter “Your paper wouldn’t be in business were it not for the subsidies that the government that you hate put in place – the same subsidies your Trump – adjacent foreign hedge fund owners gladly take to pay your salary.”

In other words – ‘what are you doing criticizing my party, you ungrateful cur. You would not have a job without the subsidies my Liberal-party-led government pays your employer’.

This is a terrible situation news orgs have put themselves in, and it’s only going to get worse. The Conservatives have for decades been unhappy with what they see as a CBC that is Liberal-sympathetic and antagonistic to them. I think the Conservatives are not wrong about that bias, but the point is that they will find a way to reduce its subsidy if they form a majority government. I will not be terribly unhappy if they do, but that is not the point – one must ask, will every change in government now result in a list of previous subsidy recipients being taken off the news media gravy train and replaced by others? Is that the kind of ‘free press’ Canadians want?

Coyne is right, government subsidized journalism is a terrible idea. That implies that the CBC was a terrible idea before this added subsidy regime was born, but widening the subsidies to take in more organizations makes a bad idea worse. A press that relies on government subsidies to stay in business is not, in any relevant sense, a free press.

I understand that the claimed reason for this is the inarguable fact that the news business is in bad financial shape. Few media orgs are able to make any profit in our brave new internet world, and almost no local news orgs can do so. Local radio stations and newspapers and even TV stations are closing their doors on a regular basis. However, Coyne’s concern – which I share – is that this subsidy regime represents a cure that is worse than the disease that spawned it. A better way to support local news media needs to be found.

A Tip of My Hat to Jagmeet Singh

Canadians will know that Jagmeet Singh is the leader of the Federal New Democratic Party, and they can probably guess that I have nothing good to say about any of the policies espoused by him or his party.

However, I want to here and now give him a public tip of my hat for something I saw him do in a video on the CBC website, which you can also view here (you’ll have to scroll to the bottom of the page for the ‘Featured Videos’, and I don’t know how long it will stay posted).

Singh is walking near Parliament with a staffer when two dudes come up behind him, filming him with their phones, and Dude 1 says out loud ‘Would you vote a non-confidence today if it came up?”

Singh ignores him and keeps walking.

Then Dude 1 can easily be heard to say “Corrupted bastard.”

At that Singh turns around and walks back toward Dude 1, saying “Wanna say something?”

Dude 1: “What?”

Singh: “Wanna say something to me?”

Dude 1: “I didn’t say nothing.”

And it goes on like that, with Dude 1, in the manner of confronted cowards everywhere, denying that he said anything, while his buddy, Dude 2, continues to film.

Security officers were right there the whole time, but I here tip my hat to Mr Singh for turning around and calling out the asshole who was only willing to insult him while Singh’s back was turned. Bravo, Mr Singh. Had Singh smacked the guy up side the head, no jury of real people would convict him of anything. The asshole asked for it.


No, a Canadian Federal Election is Not Imminent

I was going to title this post ‘Arithmetic Matters’.

Canadian politics has actually become somewhat interesting of late, which is saying something, given that Canadians – and Canadian media – generally pay more attention to US politics than to the domestic variety. However, Jagmeet Singh’s recent decision to renege on the NDP’s Supply and Confidence agreement with Trudeau’s Liberals, plus the occurrence of two by-elections on Monday, September 16 has given the chattering classes in Canada something domestic to write about.

In that vein, John Ibbitson has an op-ed in the Sept 17 Globe (read it here) with the headline With the Liberals Losing Once Safe Seats, an Election Can’t be Far Off and that title pretty much says what is the point of the column. The Liberals have indeed now lost safe seats in both Toronto and Montreal in recent months, and the NDP yesterday hung on – barely – to a once-safe seat in Winnipeg. Ibbitson thus predicts an imminent dissolution of the House of Commons and election.

Ibbitson is just wrong about this. Two facts say that is so. One, the Liberals need only one of the Bloc, The Conservatives or the NDP to support any legislation in Parliament that is a matter of confidence, to prevent the dissolution of the House. Just one.

Two, if you look at the website 338 Canada and take into account all you like the fickleness and inexactitude of polling in the 21st century, you are still left with the following numbers.

Current stated support for the major parties is as follows:

Liberals 24%

Conservatives 43%

NDP 16%

Bloc 8%

Because of the way support for these parties is distributed around the country (a key matter for the Bloc in particular), 338Canada projects that if an election were called today, the parties would win seats in the following ranges (current seats held are in () )–

Liberals 49-95 (154)

Conservatives 189-240 (119)

NDP 9-25 (25)

Bloc 31-44 (33)

Thus, even in the best possible scenario, the NDP will find itself in third place in number of seats held in a Conservative majority government, and very possibly a distant fourth, after an election held right now.

I’m sorry, Mr. Ibbitson, but while the Bloc and Conservatives might happily bring down the government tomorrow if given the chance, the Liberals need only the NDP to keep that from happening, and the NDP can read the 338Canada website, too, and so has no reason to want an immediate election, their close win in Winnipeg notwithstanding.

Happy to bet Mr. Ibbitson – or anyone else – a cold beer on this: No Canadian federal election in 2024. You read it here first, folks. Ok, maybe not first……

Two Harris-Trump Debate Related Posts

These two articles both arose from that damnable US Presidential debate, which, against my better judgement, I did watch for the first half-hour.  I have nothing useful to add to the gazillion words that have been written about the debate itself, other than to say that I switched back to watching a baseball game after 30 minutes because I was getting depressed.

Other than arising from that one event, these posts have nothing in common.

I. The BBC and the Election

The BBC website for the US and Canada is one I check regularly, despite my belief that the BBC, once among the most reliable and fact-oriented of all news-reporting institutions, is now no better than any other, and worse than some.

On Sept 12, I found the following story posted on the US and Canada BBC News website.

What the world thought of US debate

The first showdown between Kamala Harris and Donald Trump was closely watched not only in the US but around the world.

The debate in Philadelphia featured some tense exchanges on foreign policy between the two presidential candidates.

From Beijing to Budapest, here’s how the debate went down, according to BBC foreign correspondents.

…..

What then follows are brief segments from BBC reporters stationed around the world, purporting to reveal reactions to the debate from people in the countries/regions where they are stationed. In fact, there is almost nothing, beyond one cryptic quote from Ukrainian president Zelensky and two sentences from two media outlets in Hungary, that tells you what anyone around the world, be they leader, media organization or citizen, thought of the debate. It is all what the BBC correspondents think such people thought of the debate, which makes it not reporting but yet another opportunity for said correspondents to write what they wish. Not a fact to be seen anywhere. Gathering facts, going out and interviewing foreign individuals or leaders, that takes effort, and resources, and that clearly didn’t happen. So, the piece offers the reader no reporting or news-gathering, just more reporters saying things.

More sadly, one part of the piece is much worse than that, as one correspondent takes a dip into conspiracy theory. Here is one entire section of this report, nominally about the Middle East.

White House race keenly watched in Middle East

By Paul Adams, international correspondent, Jerusalem

The two candidates did not stray much from their previously stated positions last night, even if Trump did add, with characteristic hyperbole, that Israel wouldn’t exist in two years if his opponent becomes president.

Here in the Middle East, the race for the White House is being keenly watched.

With the war in Gaza raging and a ceasefire deal still elusive, some of Benjamin Netanyahu’s critics suspect that Israel’s prime minister is deliberately stalling until after the election, in the hope that Trump will be more sympathetic to Israel than Harris.

There’s a whiff of history perhaps being about to repeat itself.

In 1980, Ronald Reagan’s campaign team was suspected of urging Iran not to release American hostages held in Tehran until after he had beaten President Jimmy Carter, saying Reagan would give Iran a better deal.

Could something similar be afoot now? Certainly Netanyahu’s opponents believe he is now the chief obstacle to a ceasefire deal.

That’s Mr. Adams entire contribution, and all I can say is – Oh, my god. As I wrote, he talked to no one, quotes no one who live in the Middle East, but then – A whiff of history? The BBC’s intrepid correspondent in Jerusalem tells readers nothing about what anyone in the Middle East actually said about the debate, and then does not mention that this suspicion (he does at least use that word) about the Reagan campaign’s interactions with the Iranian government in 1980 was investigated by two separate US Congressional committees, who found no credible evidence of its truth. Indeed, the Chairman of the House task force, a bloody Democrat, went to the trouble of publishing an editorial in the NYTimes in 1993, shortly after his investigative committee published its findings, saying there was no credible evidence to support the claims of Reagan campaign efforts to delay the hostage release, and most of the people who testified that it had occurred could not be believed. No mention of any of that in the BBC story. You can actually read the report of the Congressional Task Force here – all 998 pages of it. Yea, I know, not likely – I’m betting Mr. Adams hasn’t read it, either, but there’s no need to if your only intent is to find another bad thing to attach to Netanyahu, if only by implication.

As I said, how the mighty have fallen. A BBC correspondent reviving what can only be seen as a (rather old) conspiracy theory, in the guise of reporting on an ongoing US presidential campaign.

II. The Debate’s Impact on Two Prediction Markets

I got this idea from a blog I follow by Rajiv Sethi, called Imperfect Information. He is very interested in prediction markets, and this post is about how two such markets reacted after the debate. If you want to read his (more techy and detailed) take on this, it’s freely available here.

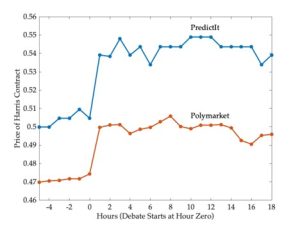
For those who don’t know, a prediction market refers to a platform on which you can buy a ‘share’ in the outcome of some future event. In this case, you can either buy a share that Kamala Harris will be elected president, or buy a share that Donald Trump will be elected president. This is really placing a bet, because what buying a share in, say, Kamala Harris gets you is a payment of a dollar if Harris wins, and nothing if she loses. The terms of that bet then depend on what you paid for that share. In the graph below, which I reproduced from Sethi’s blog post, the prices at which one could buy a Harris share on two different prediction markets is displayed, during the hours just before and just after the debate.

Note that on PredictIt a Harris share was priced at 50cents four hours

before the debate. That means that betting on Harris by buying a share was an even bet; you pay 50cents and get a dollar back if she wins and lose your 50cents if she loses. Someone who thinks she has better than an even chance at winning might therefore buy a share, and someone who thinks she is more likely to lose would not. On the Polymarket site, a Harris share cost only 47cents four hours before, so that would be a good bet perhaps even for someone who thought she had only a 49% chance of winning. [It’s actually a bit more complicated than this, as Sethi explains in his long post, because Harris and Trump contracts are traded separately. What I write above is close enough for a basic understanding of these markets.]

As you can easily see, the price of a Harris contract jumped on both markets right after the debate, even though they continued to be different.

Sethi’s post delves into how these two sites can offer different prices on a Harris contract at the same moment in time, and the possibilities of making money by betting on both markets when this is true. I am writing about it here just to note that both markets saw the price of a Harris share (contract) jump immediately after the debate, reflecting the fact that people trading on those markets in general thought her chances of winning went up, and this was reflected immediately in the price of a Harris share. It would also be reflected in a drop in the price of Trump shares, which are not depicted here.

This contrasts with the fact that so far, none of the opinion polls that have updated since the debate, so far as I know, have seen any change in the ‘intend to vote for’ numbers for the two candidates. This is a big difference in how prediction markets and polls, both of which can be said to ‘predict’ the electoral outcome, operate. Markets are always open, so right after the debate, or even while it was ongoing, people can go and buy and sell shares if they think what is happening has changed the probability of a Harris win. Polls have to wait until a new survey is done and compiled before they can reflect the effect of an event like the debate.

However, along with the fact that markets react more quickly to events than do polls, there is the fact that they can offer different predictions. As I say, no poll of which I am aware thinks the debate changed either candidate’s support, whereas the two markets above reflect considerable movement. I admit I don’t know what has happened since the time frame depicted on the graph, prices can change constantly on these markets.

Now, whether polls do a better job than markets in predicting outcomes is – so far as I can see – undecidable. With an event like this election, one candidate wins, and all either a poll or market tells us any time prior to that is a probability. If the market says the probability of a Harris win is 0.55 at some point in time, and Harris eventually loses, there is no verifiable sense in which the market was ‘wrong’. There was, after all, a probability of 0.45 that Harris would lose at that same point in time. Unless a poll or market states a probability is either 0 or 1, it cannot be wrong. One can of course just declare that if the prediction of something happening is greater than 0.5 and that something does not happen, then the prediction is ‘wrong’, but I think that is based on a misunderstanding of the concept of probability. Similarly, if a poll says Harris has a 50% chance of winning and at the same time a market says it is 55%, and she wins, does that mean the market prediction was ‘better’? One can declare that to be so, but again, it’s not clear to me what that really means, since both allowed that her losing was a legitimate possibility.

None the less, one can easily find people who will argue for the superiority of one over the other. Folks do like to argue.

Interestingly, it is very difficult to operate a prediction market devoted to the US Presidential election in the US itself. The SEC and other US regulators have come down hard on the ones that did exist (one of the first was built by economist George Neumann at the University of Iowa) as being unregulated trading platforms, which forced them to shut down or leave the US. PredictIt is based at The Victoria University of Wellington in Australia, and Polymarket operates on crypto currency only, and although it now seems to be operating legally in the US, it was fined $1.2million in 2022 by The Commodity Futures Trading Commission. Wikipedia (not my favourite source for credible info) claims over $700million has been wagered on the presidential election on Polymarket.

Speeding Rich People

This post is about something interesting that I just read about in an academic paper (which you can also read here). It’s titled ‘How Do People React to Income-Based Fines? Evidence from Speeding Tickets Discontinuities’ and I know, ‘interesting’ and ‘academic paper’ are not supposed to show up in the same sentence…..

It turns out that in Finland, according to the author of this paper, the fine one pays if caught driving at more than 20km/h over the posted limit depends on your income. If your income is below a set cut-off, you pay a set fine, but if it is above that cut-off, then the size of the fine increases with your income. The paper includes the following sentence – ‘For example, in 2019, the Police assigned NHL ice hockey player Rasmus Ristolainen an income-based speeding ticket equal to approximately 120,000 euros.’

Ouch, eh? I do wonder if it was the police who set that fine or a magistrate, but either way, that’s a big speeding ticket.

One question to ask here is why Finland does that. The obvious – but still perhaps wrong – answer would be that Finland’s government operates under a pretty egalitarian ethic, which might be seen to imply that rich folks should pay more; for everything, including breaking the law. However, these economists are interested in this system not for that reason, but because a well-known theory of crime deterrence, due to now-dead economist Gary Becker, would predict that with this speeding fine structure, one should find that a lot of speeders are caught doing 19km/h or less over the limit. That is, if you bar-graphed the number of tickets given for being 1km/h, 2km/h……15km/h…..19km/h, 20km/h, 21km/h…..30km/h etc, over the limit, then the bars at 18 and 19 should be noticeably higher than the other bars. Put simply, no one wants to get dinged for doing 20 or 21 over when one could incur a much smaller fine by slowing down just a little.

Unfortunately for Becker, not that he cares now, this does not turn out to be the case, according to these researchers. One might instantly say that maybe that’s because most speeders have incomes below that cut-off, and hence don’t face that steep increase in fine if they do 20km/h+ over, but in fact these guys have really good data, including about the speeders’ incomes, so they can tell that the bunching does not happen even among drivers with incomes above the cut-off.

What they do find is that the higher income drivers who get pinched with the higher fine tend to slow down afterwards. Quoting from the paper:

“Those assigned, on average, a 200 euro larger fine are approximately 2-3 percentage points less likely to commit another traffic crime in the following 4-8 months. Compared to the average speeding behavior of the speeders who receive a smaller fixed fine, this estimate implies a 15-20 percent reduction in recidivism.”

I should stress that this is a research paper that has not yet been peer-reviewed, and I am not about to vouch for how well the statistical and data work was done.

I will, however, suggest that the Becker prediction of bunching would not be expected to hold in this instance – at least not by me – given that those who pay the higher fines are, by definition, folks with higher incomes, who therefore might be expected to be willing to pay higher fines. It is basic to economic theory that people with higher incomes have – other things being equal – a higher willingness to pay for most things, including driving fast. Indeed, one might expect that higher-income people put a higher value on their own time, which they can ‘save’ by driving fast. The author does not seem to consider this, as his behavioral model assumes that drivers may value speeding differently, but that any differences are purely idiosyncratic, and so not related to their income.

In fact, it occurs to me that all this really has nothing to do with the fines in Finland being based on income for richer folks, although that is what originally caught my eye. What Becker’s theory says is that people react to an increased fine by being less likely to speed. Since the fines for going above 20km/h over the limits are higher than for going less fast than that, people will go 19km/h over rather than 20 or 21. It doesn’t really matter that the amount of the fine is based on income, what matters is that it goes up at the 20km/h threshold.

Given that,  one could do a cleaner test of Becker’s theory in Ontario, where speeding fines are as follows:

Less than 20 km/h over: $3.00 per km/h over .

20 to less than 30 km/h over: $4.50 per km/h over.

30 to less than 50 km/h over: $7.00 km/h over.

Above 50km/h over: $9.75 per kh/h over.

(One also gets ‘demerit points’ added to one’s driving record for speeding. Those have consequences too, and the number of demerits you get depend on how fast you go – but the thresholds, for some reason, are different than for the fines. Go figure.)

Thus Ontario speeding fines depend on how fast you go, but not on your income, and there are three thresholds where the fines jump. Becker’s theory would predict bunching below 20, 30 and 50km/h over in response to this fine structure. And, doing more than 50km/h will get you charged with a second offense, ‘stunt driving’, which involves a whole additional set of penalties, including a fine of $2k to $10k (set by a judge, not your income, because if you go that fast, you have to go to court). Another reason for Becker’s theory to predict bunching under 50km/h.

Thus one could test Becker’s deterrence theory in Canada without any need for data on the incomes of the speeders. (You’d have to take into account the effect of the demerit point thresholds, too. Complicated.) Which would be good for anyone who set out to do this, because I’m pretty sure that, unlike in Finland, such data does not exist. The Finns (and the Danes, I think) seem to be happy with their government collecting all kinds of data on them, whether they speed or not. Canadians and Americans, not so much.

So far as I know, Becker’s theory has not generally done all that well when confronted with data about actual criminal behavior. A couple of economists did a review in 2014 of the empirical (that is, data-driven) research on criminal deterrence, and this is from the Abstract of the paper they wrote about what they found in their review (which you can download here):

“While there is considerable evidence that crime is responsive to police and to the existence of attractive legitimate labor market opportunities, there is far less evidence that crime responds to the severity of criminal sanctions.”

That response is central to Becker’s theory, and a theory that predicts behavior that does not seem to occur out in the world is what is known as a bad theory. That does not prevent it from being quite famous, however – among economists, at least.


Municipal and Hospital Spending – At Your Service?

This article was triggered by my reading a story in the Aug 12 Freeps that had the following sub-headline:

Two city politicians want their colleagues to pull $3 million from municipal savings to slightly reduce the relatively large tax increases that will hit Londoners over the next three years

In the story itself one then finds the following:

“The new motion proposes pulling $1 million from a city reserve fund each year from 2025-27. This amount would cut next year’s property tax increase by 0.13 per cent (from 8.7 to below 8.6), which [Councillor] Pribil acknowledges isn’t much.”

No, Jerry – not much, but I know we ratepayers appreciate the gesture.

In case any of you Londoners haven’t been paying attention, the current and future property tax increases in the multi-year city budget are:

  • 2024: 8.7 per cent
  • 2025: 8.7 per cent
  • 2026: 5.7 per cent
  • 2027: 6.7 per cent

The two years at 8.7% represent greater increases than I can remember seeing in my 40+ years of living here. I do wonder how they arranged things so that the percentage increase in every year was x.7. Someone at City Hall believes in lucky 7?

However, we Londoners are not alone. A report from the Fraser Institute called Municipal Dollars in Ontario – Where did the Money Go?, dated April 2024, reports the following:

“Municipal budget season in Ontario recently ended and the evidence reveals some fairly substantial tax increases around the province. For example, Waterloo Region approved a property tax increase of 6.9 per cent while Toronto passed an increase of 9.5 per cent. Hamilton ultimately saw an increase of 5.8 per cent after fears of a double-digit tax increase were unveiled in the fall while Kingston saw one of the lower increases coming in at 3.5 per cent.”

Note that London’s 2024 increase came in second to only that of Toronto, at least in this group.

What I found most interesting in the report was the discussion of how the increased tax revenues are being spent. Again quoting from the report:

“So, pulling everything together, here’s the story that emerges. Municipal operating expenditures in Ontario over the period 2000 to 2022 have grown 2.5 times faster than general inflation and double that of population. They have also grown a bit faster than the province’s output.”

“The increase in spending is driven by spending on wages and salaries but not in the manner one might think. Average salaries in the municipal sector for those making more than $100,000 annually since 2000 have grown by only 8 per cent but the number of individuals making those salaries has grown in the thousands of per cent. Within the broader public sector, in 2000 municipal employees accounted for 6 per cent of individuals on the salary disclosure list whereas by 2022 they accounted for 23 per cent.”

So municipalities are not necessarily employing very many more people, as one might think they must to serve increasing populations, but rather they are paying the people they employ much better.

Now, to be fair, this could be because they are employing people with different sets of skills than they did in the past. More folks with university degrees or highly specialized (and highly remunerated) training. Another factor left out of the report is the extent to which Ontario municipalities have shifted from having services provided by city employees to having them provided by private firms that bid for the city contracts. To the extent this happens, it will reduce the number of city employees, and – I suspect – reduce most the number of relatively low-paid employees. A municipal sanitation division is going to employ a lot of low-wage workers and a few managers, so if you contract out garbage pickup to a private contractor, that takes a lot of low-wage jobs off the city books, but only a few better-paid managerial positions. The cost of the contract with the private provider then does not come under the heading of ‘employee compensation’, but rather ‘payments for goods and services’. I suspect that has happened a good bit over the last 20 years, but can’t find any data on it: the Fraser report is silent on this possibility.

If you’re wondering how much of municipal spending goes to employee compensation (and you know you are) the Fraser folks have the answer for you:

“The composition of major expenditures is revealing: 37% of operating expenses are in employee compensation, another 28% are from the purchase of goods and services to run municipal operations, and 20% are expenses associated with fixed capital-consumption costs.”

So, yea – employee wages are kinda driving the expenditure bus, but as noted above, not because municipalities are employing more people to serve you better; they’re just paying the people they employ better. Or, putting it another way, they’re just employing more people who are better-paid.

I’d guess that will not surprise anyone who has tried to get any kind of service out of London City Hall. So far as I and those around me can tell, no London City employee ever answers their phone if they know (and they do) the call is coming from outside the building. ‘Your call is very important to us, please leave a message.’

Well-Paid Bureaucrats

We live in the Age of The Well-Paid Bureaucrat. This is not just a government phenomenon. I would suggest that all LBOs (Large Bureaucratic Organizations), whether government, non-profit or for-profit, see over time an increase in the proportion of their employees who are highly paid; say $150k+.  As an org grows, it tends to increase its employment of senior management types faster than its general increase in employees. (This is absolutely inarguable for universities….) Why? Wish I knew……

An illustration of this general principle shows up in another article published in the Freeps over the weekend. London Health Sciences Centre, the administrative monster that is now being run by an ‘interim chief executive’ brought in to reorganize it (and deal with a looming $150 million deficit), has let go two of its senior administrators. According to the Freeps, the administrators are

  • Brad Campbell, corporate hospital administration executive, was in charge of overseeing the presidents of University Hospital, Children’s Hospital and Victoria Hospital
  • Sandra Smith, who was regional vice-president for the southwest regional cancer program at LHSC

The title ‘corporate hospital administration executive’ is suitably vague, and his job was ‘overseeing three presidents’. Well, that clarifies his duties, right?

For this he was paid, according to the Freeps again –  ‘$475,423 in 2023, a significant raise over the $217,007 he made in 2022’. Significant raise, indeed, but what the heck did he do to earn such a salary? What does ‘overseeing presidents’ entail, exactly? (Smith made a modest $244k in 2023. I don’t know what a regional VP does, either.)

Sadly, as high as those salaries are, eliminating them from the LHSC budget is no more than a drop in the $150 million bucket.

Of course, LHSC is not a City of London operation, and I suspect (but don’t know) that there is no one in the London City administration making the lofty salary that Mr. Campbell did in 2023 – at least I hope not. But the general principle remains. As amalgamation turned three hospitals into one giant org, the number of senior administrators – and the salaries they earn – went up, and just kept going up. It takes a lot of highly paid people to run a LBO – just ask those highly paid people, they’ll tell you its true.

A worthy research project, if one could get the data – and I bet one could not – would be to look at a large set of LBOs of all types and see how the number of highly paid senior administrators has changed relative to total employment over, say, 20 years. My hypothesis obviously is that proportion has gone up over time, but I wonder in which type of org it has gone up the most. Non-profits, universities,  for-profit corporations, government bureaucracies? It would be interesting to see if there is any discernible pattern. My money would be on universities as the leaders, but that’s probably because I saw it happen in one of those first hand over the last 20 years.

But I betcha $100 no LBOs of any type would give one the data one would need to find out.

PostScript

Just as I was about to post this, a story popped up on the CBC-London website, saying that LHSC had just fired 5 more senior administrators. To quote the CBC story:

“Five executives with a combined tenure of over 20 years, and a combined 2023 salary of over $1.6 million, are no longer with the organization, Musyj said. They are:

  • Abhi Mukherjee, CFO, who joined LHSC in September 2022

  • John French, clinical diagnostic executive, who joined LHSC in September 2022

  • CJ Curran, corporate health disciplines executive, who joined LHSC in September 2022

  • Dipesh Patel, capital redevelopment and environmental operations executive, who joined LHSC in July 2013

  • Jatinder Bains, corporate academic executive, who joined LHSC in April 2021

‘….combined tenure of over 20 years’? C’mon, CBC, only one of them has been around more than three years, the other four are all very recent hires. CBC did not give their salaries (I suspect the public broadcaster is a little sensitive about executive salaries these days), but you could look them up on the sunshine list. I think I know what a CFO does, but the other titles? Like, ‘corporate academic executive’? Surely they just made that up.

Let me quote once more from the article.

“Dr. Jackie Schleifer Taylor, the former CEO, left this past spring after a seven month medical leave. Her salary in 2023 was almost $804,000. ”

“During Dr. Schleifer Taylor’s tenure, president positions were created, one at each Victoria, University and Children’s, replacing the former structure which had just one one[sic] president for the entire hospital system.”

So, now we know what the afore-mentioned Brad Campbell did to earn his big salary. When Schleifer Taylor created three presidential positions where there had previously been only one, she of course had to create a fourth position – held by Campbell – to oversee those three. Now that is bureaucratic thinking par excellence.

What the Google Just Happened?

Much of the material I write about in this blog is taken from the news media, obviously, but sometimes I write about the story or issue that the media piece is covering, while other times I am writing about the media piece itself. This article is going to be of the second type.

You have likely read or heard that the US Department of Justice brought an antitrust case against Google (four years ago, actually), and that the judge presiding over this case has just recently found against Google. Most headlines say something like ‘Google found guilty of being a monopolist’. This is an oversimplification. The DoJ accused Google of violating a rather specific US antitrust statute, and the judge found that it did. In this case (you can read the judge’s decision here) it was Section 2 of the Sherman Antitrust Act, and here is what the judge himself had to say about that statute in his decision:

“Section 2 of the Sherman Act makes it unlawful for a firm to ‘monopolize.’ ….The offense of monopolization requires proof of two elements: (1) the possession of monopoly power in the relevant market and (2) the willful acquisition or maintenance of that power as distinguished from growth or development as a consequence of a superior product, business acumen, or historic accident.”

Thus, it is indeed true that the DoJ had to show that Google has ‘monopoly power’ in the search engine market (arguing that aspect of the case is where a bunch of economists made big consulting fees, you can bet). However, it also has to show that Google did something willful to acquire or maintain that monopoly power. Being a monopoly due to, say, selling a superior product, implies no harm, no litigation.

From what I have read, it is Google’s agreements with other companies – like Apple – to make Google the default search engine on the devices they sell in return for a payment from Google that were found to violate part (2) above. For example, Google paid Apple $20B (yea, that’s a B) for making Google the default search engine on every iPhone’s Safari browser.

A lot has been written about the consequences of this decision for average Joes and Jills like you and I. How, if at all, will it change what happens on the internet, particularly in searching the web?

I haven’t read everything written about this, and there has been a lot, but I did come across an article on the National Post website, posted on August 9, written by one Matt Stoller, with the title:

Landmark decision means Google’s control of the web is ending

Wow. I am aware that Mr. Stoller almost certainly did not write that headline for his article, but a note to whoever did – this case was about Google’s search engine only, and if you know anything about Google, you know they have plenty of other operations on ‘the web’ (the parent company, Alphabet, owns Youtube, just to name one). In any case, it is a bit much to talk about Google’s ‘control of the web’. (If any firm could be said to ‘control the web’ my money would be on Microsoft, but that’s a blog for another day).

However, the rest of the article I have to credit to Mr Stoller, and he has some remarkable things to say about this just-issued decision. For example, he writes: ‘So there we go, Google’s control of the web is ending.’

Ah. So, maybe he did write that headline.

Then there’s this –

‘The implications of this decision will have ripple effects across the internet, the law, and big business for generations.’

Generations. One senses a taste for hyperbole in Mr. Stoller’s writing, no?

Here are two facts about this case that seem relevant to understanding how important it will turn out to be for average internet users.

  1. Google has already said it will appeal the judge’s ruling.
  2. The judge’s decision is the final step in what is only the first stage of this trial, which is called the ‘liability’ phase. What now follows is the ‘remedy’ phase.

Regarding point 1, some of you may recall that in the early 2000s the US brought a case based on the same Section 2 of the Sherman Act against good ol’ Microsoft, accusing it of monopolizing the market for personal computer operating systems. The government won that case too, but it was then overturned by the US Court of Appeals for the D.C. Circuit. So, it’s a bit too soon to be counting any chickens, and the judicial appeal process could drag on for some time.

Stoller ignores my point 1 in his article, but not point 2, since he writes the following:

“This part of the trial was what is called the liability phase, which is to determine whether Google broke the law. Judge Mehta found that it did. The next stage is called the remedy phase, during which the court will hear arguments about what to do to address the bad conduct.”

What to do, indeed. A company the size of Google, even just its search engine division, is an incredibly complex organization. It is fair to say that no one working in Google’s search engine division – including the person at the top – is aware of everything that happens within it. It’s just too big and complicated. So, what do you suppose are the chances that the DoJ and the judge, who agree that Google has behaved badly, but know approximately nothing about running a tech company, can figure out what remedy is needed to force Google to behave better in the future?

They can, presumably, do the obvious thing of declaring illegal Google’s contracts with Apple and others regarding the Google search engine’s status as the default search engine on their installed browsers. But it will still be true that Apple et al are going to choose some search engine to be available on the devices they sell. Do we really believe that Google can find no other way to persuade those companies that Google’s search engine is the one they should have as the default on their installed browsers? Given that (according to the Financial Times) Google currently handles more than 90 per cent of online queries  and that ‘google’ has become a synonym for ‘search for’, why indeed would all the companies with whom Google currently has agreements not leave it as their default search engine? It’s already the one most people use. What can the learned judge and assorted lawyers and economists working for the DoJ possibly come up with to change that simple fact?

Finally, a comment on the Stoller article’s most hyperbolic paragraph:

“What about the rest of business? Well, this decision means monopolization law is back. Exclusive contracts and arrangements are pervasive in American commerce, and until recently, executives could reliably exploit such deals without fearing that they might face any legal liability. But that era is over. This case is in the headlines, which means every single competent executive in America in any firm with market power is going to get a memo from their antitrust or general counsel on what they can and can’t do going forward. And they will likely begin changing their behaviour to avoid being brought to court for monopolization.”

So Stoller thinks the case will trigger memos from counsel all across the corporate universe. Well, maybe not. Even if this Google decision is not reversed on appeal, and even if the DoJ and judge come up with some way to actually reduce Google’s ongoing share of the search market, it is simply not true that any Google executives are going to face ‘legal liability’. Google might have to pay a fine, and it might be a whopper. However, for any person within Google to face a legal sanction, the DoJ would have had to bring a criminal case against Google (and its executives) under Section 2 of the Sherman Act. The DoJ can do this, but they did not in the Google case, and in fact they almost never do. What they did was sue Google, a very different matter. The reason for this is simple; the DoJ can only win a criminal case against Google or any of its executives if it proves its allegations beyond a reasonable doubt. That’s a much higher standard than the standard of proving one’s case by a preponderance of the evidence, which is what is required in a civil lawsuit. The DoJ wanted to win this case and change Google’s business practices, so they filed a lawsuit, not a criminal case. Google executives might get fired by their company, but legal liability is not on the table.

The only antitrust violations that are typically prosecuted as criminal cases in the US (Canadian law and practice are similar in this regard)  are those of price-fixing or bid-rigging, which violate  Section 1 of the Sherman Act. In such criminal cases executives can indeed be fined or even imprisoned if the government wins the case, but again, this is not what happened in the US vs Google case.

Going forward, there is perhaps some reason to think executives of other companies need to worry about ‘legal liability’ for entering into exclusive contracts that violate Section 2, but only because in 2022 the DoJ announced that they would start pursuing more criminal cases under Section 2 of the Sherman Act. The Department has in fact filed two Sherman section 2 criminal cases in the last 50 years, one in 2022 and the most recent in 2024. However, they didn’t pursue a criminal case against Google, and the two recent cases in which criminal charges were brought were against executives of relatively small companies.  So, if other executives have reason to be worried about legal liability, it does not arise from the judge’s decision in phase one of this case against Google.

If executives in other companies got memos about what to do or not do from their legal counsel, it would have happened after the DoJ’s 2022 announcement, not after judge Mehta’s recent decision in this case. And….did those memos cause executives in other companies to change their behavior? No way to know, really, until and unless more criminal Section 2 cases actually are brought – and maybe not then.

So maybe ‘….monopolization law is back’ is a bit premature. However, it is not fair to be too hard on the enthusiastic Mr. Stoller. If you go to the Financial Times article on this case, available here, you will find other worthies waxing equally hyperbolic about the meaning and significance of this still-incomplete case.

Peeps are gonna believe what peeps wanna believe.


An Ex-Mayor and an Editor Walk into a Bar

A tip of the hat to The Wall Street Journal for putting this in their Notable and Quotable column. The Journal’s Editors don’t comment on whatever appears in this column, they just publish it for their readers to see. Having seen it, I have a comment or two.

As background, Keisha Lance Bottoms is a former mayor of Atlanta, Georgia, a city with a population of about 500,000, which is the centre of a metropolitan area of some 6 million. Not a small job.

Ms. Bottoms has a different job now, something in the commentariat business. After the Biden-Trump debate, she was interviewed on MSNBC, and here is the WSJ’s report of part of that conversation –

Former Atlanta Mayor Keisha Lance Bottoms speaks with MSNBC host Chris Jansing, July 1:

Ms. Jansing: Your hometown paper the Atlanta Journal-Constitution is among those saying it’s time for President Biden to pass the torch. The editorial board wrote, “This wasn’t a bad night. It was confirmation of the worst fears of some of Biden’s most ardent supporters.” . . .

Ms. Bottoms: Let me just say I was very disappointed with the Atlanta Journal-Constitution. We have talked about making sure we’re protecting elections and making sure there’s no undue influence. This was undue influence by the Atlanta Journal-Constitution or an attempt to influence. I think voters should be able to make decisions the same way they did in the primaries.

Ms. Jansing: But isn’t that what editorial boards are supposed to do?

Ms. Bottoms: Editorial boards are supposed to honor fair elections. I don’t think it’s fair when an editorial board with 10 people sitting in a room are trying to influence an election.

– There you have Ms. Bottoms’ take on the role of newspapers in the 21st century.

I’ll first just say that this is a good example of the tendency for supposedly knowledgeable people to say things that would have – even 20 years ago – been considered laughable.

Note the use by Ms. Bottoms of the terms ‘undue influence’, ‘protecting elections’, and ‘honor fair elections’. This is typical cant for most members of what passes for an intelligentsia in the 21st century. There is a list of unquestionable and unpardonable sins, like colonialism and oppression, ready and waiting to be attached to anything one is against. ‘Election influencing’ is another such sin – although I suspect only when practiced by the wrong people to influence elections in the wrong way.

Beyond that – what is it about the ‘10 people sitting in a room’ that is unfair? Would 5 people be fair, or would a thousand be more fair? Is it the fact they are sitting in a room at all that makes it unfair? Would it be fair if they were standing, or – kneeling?

And the sentence ‘I think voters should be able to make decisions the same way they did in the primaries.’ is beyond the pale. Does Ms. Bottoms believe that The Atlanta Journal-Constitution Editorial Board did not publish any commentary on the candidates in the primaries when those were being held? Or, perhaps they did not write those when sitting in a room.

It has become the sole job of virtually all political operatives, be they candidates, office-holders, advocates, activists or spin doctors, to quote talking points. Never mind a reasoned analysis, god forbid you should explain why you disagree with the Editorial Board’s position. Just get in your words – ‘honor fair elections’ – and retreat from the field claiming a score.

As I say, someone 20 years ago who said what Ms. Bottoms said above would have been laughed at. Today, I’m sure she has been favourably quoted by other, similar, political operatives.

Smiling – and Paying – for the Camera

A short article by Scott Kitching appeared on the June 11 London News Today website letting us know that London City Council has authorized adding another 15 redlight cameras to the 10 that are already operating around the city. Our illustrious Mayor was quoted:

“More Red Light Cameras help limit dangerous driving behaviours at more locations in our City, and address a widespread community concern,” Mayor Josh Morgan said in a statement released by the city.

This statement can of course be used to justify putting a red light camera at every intersection in London, so stay tuned, folks.

Kitching also included some ‘statistics’ – reportedly provided by ‘the city’. That’s all the detail regarding the source of said stats we get. Quoting from the article:

“Since the red light camera program began in 2017, the number of collisions at intersections with signals has fallen by between eight and 11 per cent, according to the city. The number of collisions involving injury or death is down by 40 per cent over the same time period.”

Ok, the first stat seems like it is perhaps relevant to understanding the impact, if any, of the 10 existing redlight camera set-ups. Nothing is said about controlling that 8 to 11 percent drop for changes in the volume of traffic through intersections with signals, but there is a more important issue with it. That is an 8 to 11 percent drop ‘at intersections with signals’. Not  at intersections with red-light cameras, but rather all signaled intersections.

So; does this mean there has been a general trend down in collisions at signaled intersections? If so, that cannot possibly be attributed to the 10 (out of hundreds) of intersections that have the cameras. What we need to know here is what has been the trend in collisions at the camera intersections compared to the trend over the same time frame at all the other (non-camera) signaled intersections. The stat as quoted tells us precisely nothing about the impact of the cameras on collisions at signaled intersections.

As to the second sentence in the quote, I have no idea what that tells us. The number of collisions involving injury and death is down 40% – is that throughout the city overall? At signaled intersections generally? At signaled intersections with cameras only?

That second stat as stated tells us nothing about anything related to the impact of existing or planned red light cameras on traffic injuries or fatalities in London.

Ah, but who needs evidence, really? According to a CBC.ca London article on this City initiative, these cameras make money (for the city, not you fine folks). CBC London quoted London’s Director of Transportation and Mobility, Doug MacRae, thusly:

The cost of operating the new red light cameras for one year is approximately $1 million, MacRae said, but notes that they pay for themselves through the fines issued.

Per Inspector Brackenreid: Follow the money, Murdoch.

The impact of strip clubs on sex crimes

I ended a post back on April 25 with the following question:

Does the presence of bricks-and-mortar adult entertainment establishments have a positive, negative, or no effect on the commission of sex crimes in the surrounding neighborhood?

I then asked you to consider what sort of data would be required to provide credible evidence as to what is the correct answer to that question.

Fair warning, this is going to be a longish article, but I would suggest that a credible answer to the first question above has some social value. And, full disclosure, this post is part of my ‘Studies show’ inoculation campaign.

‘Swat I do.

I do think the answer to this question is of more than passing interest.

If the presence of adult entertainment establishments (aee’s, henceforth) like strip clubs and such could be shown to reduce the incidence of sex-crimes like sexual assault and rape, this might be counted as a reason to allow them to operate. If, on the other hand, they are associated with an increase in such crimes, then that is a reason to ban them entirely. The ban/allow decision for aees is of course complex, and other factors may also be important (e.g., links to organized crime, drug use). Still, the answer could be a significant input into city policy-setting on such places.

More disclosure, this is not a very original post. I got wind of all this reading Andrew Gelman’s Statistical Inference blog back when. However, he didn’t dig into the details much.  I have, and I think it is another nice illustration of an important principle: if it sounds really good, be skeptical.

Ok, then – our story begins with a paper by two economists titled “THE EFFECT OF ADULT ENTERTAINMENT ESTABLISHMENTS ON SEX CRIME: EVIDENCE FROM NEW YORK CITY”,

which was written by Riccardo Ciacci and Maria Micaela Sviatschi and published in 2021, in The Economic Journal, a well-respected outlet in my old discipline.

The following sentence from the Abstract of their paper lays out what they find –

“We find that these businesses decrease sex crime by 13% per police precinct one week after the opening, and have no effect on other types of crime. The results suggest that the reduction is mostly driven by potential sex offenders frequenting these establishments rather than committing crimes.”

Trust me, if true, that’s a big deal. A 13% reduction on average, and in the first week after the aees open.

Social scientists rarely find effects of that size attributable to any single thing. That’s huge. One might even venture to say – unbelievable.

It is not surprising that The Economic Journal was happy to give space in its pages to publish these results. And, coming back to what I wrote above, what city politician could ignore the possibility that licensing aees in their jurisdiction might reduce sex crimes by 13%?

To dig deeper we return to the ‘extra credit’ question I posed on that post of April 25 – what kind of data would one need to answer the question?

Well, you need to be able to make a comparison of sex crime numbers between areas where aees operate, and areas where they do not. An obvious possibility is to find two political jurisdictions such that one contains aees, and the other, perhaps due to different laws, does not. Then you can compare the incidence of sex crimes in those two jurisdictions and get your answer.

That approach is just fraught with difficulties, all following from the fact that the two jurisdictions are bound to be different from one another in a whole host of ways, any one of which might be the reason for any sex-crime difference you find. Demographics, incomes, legal framework, policing differences, the list goes on and on. You can try to account for all that, but it’s very difficult, you need all kinds of extra data, and you can never be certain that any difference you find can actually be attributed to the presence/absence of aees.

The alternative is to look at a single jurisdiction, like NYC, and find data on where aees operate and where they do not. Now NYC is a highly heterogeneous place – it’s huge, and its neighborhoods differ a lot, so it sort of seems like we’re back to the same problem.

However, suppose you can get data on when and where aees open and close in NYC. Then, you have before and after data for each establishment and its neighborhood. If an aee started operating in neighborhood X on June 23, 2012, you can then look at sex crime data in that area before and after the opening date. You still want to assure yourself that nothing else important in that neighborhood changed around that same time, but that seems like a doable thing.

This is pretty much what our economists did, as we will see, but there is still another issue; data on sex crimes.

All data on criminal activity carries with it certain problems. Data on arrests and convictions for crimes is generally pretty reliable, but crimes are committed all the time for which no arrests are made and/or no convictions occur. Still, the crimes occur, and for the purposes of this question, you want data on the occurrence of sex crimes, not on arrests for them.

We’ll come back to the crime data below, but I’ll start with the data on aees.

The authors note that if you are going to open a strip club in NYC there is a bureaucratic process to go through, and the first thing a potential operator of such has to do is register the business with a government bureau.

To quote directly from the paper:

“We construct a new data set on adult entertainment establishments that includes the names and addresses of the establishments, providing precise geographic information. We complement this with information on establishment registration dates from the New York Department of State and Yellow Pages, which we use to define when an establishment opened.”

So, the researchers know where each aee opened, and they know when, but do note for later, that for the ‘when’ bit they use the date of registration with the NY Department of State.

The location that they get from the Dept and the Yellow pages then allows the researchers to determine in which NYPD precinct the aee is located, and that is going to allow them to associate each aee, once it opens, with crime data from that precinct.

So, what crime data do they use? As I’ve noted, such data always has issues.

Here’s one thing the economist say about their crime data.

“The crime data include hourly information on crimes observed by the police, including sex crimes. The data set covers the period from 1 January 2004 to 29 June 2012. Since these crimes are reported by the police, it minimises the biases associated with self-reported data on sex crime.”

Ok, hold on. ‘Crimes observed by police’? What does that mean? How many of the people arrested for or even suspected of a crime by the police had that crime observed by the police? Speeders, stop-sign ignorers, perhaps? But burglars, murderers, and – the point here – sexual assault or rape? How often are those crimes observed by police?

The vast majority of crimes come to light and are investigated by police on the basis of a report by a private citizen. In the case of sex crimes, most often a victim is found somewhere or comes to the police after the crime has occurred, inducing police to begin an investigation.

This sentence from the paper clears things up….a bit.

“We categorise adult entertainment establishments by New York Police Department (NYPD) precincts to match crime data from the ‘stop-and-frisk’ program.”

Ah. You may remember NYC’s (in)famous ‘stop and frisk’ program of several years (and mayors) ago. NYPD officers would stop folks on the street and – chat them up. Ask questions of various kinds, and then fill out and turn in a card that recorded various aspects of the encounter. As we will see below, virtually none of these s-a-f encounters resulted in a report of a crime or an arrest.

So….’crime data’? From stop and frisk encounters? Need to know a lot more about how that data was used.

And we shall, but let’s go back to the other key bit of data – where and when aees opened in NYC. The date used for the aees ‘opening’ is, according to the quote above, the date on which each establishment was registered  with the NY Dept of State.

Can you think of any establishment that needs a city or health or any other license to operate, that actually starts serving customers the day after it files the licensing paperwork?

To be sure, I have never operated a business, but I don’t think that can possibly be how it works. For one thing, how many different licenses do you suppose a strip club needs to operate at all? A health inspection, a liquor license, a fire inspection, building safety certificate….?

This is not a detail, because the BIG Headline this paper starts with is that a strip club reduces the number of sex crimes in the precinct in which it is located in the first week of operation. If the researchers are using the date of registration to determine when was that first week – there’s a problem.

 Ok, time to let the rest of the cats out of the proverbial bag. I mentioned above that I came on this research through a post on Gelman’s blog in which some folks expressed considerable skepticism about the economists’ findings. Those skeptics are, to give credit where due:

Brandon del Pozo, PhD, MPA, MA (corresponding author); Division of General Internal Medicine, Rhode Island Hospital/The Warren Alpert Medical School

Peter Moskos, PhD; Department of Law, Police Science, and Criminal Justice Administration, John Jay College of Criminal Justice, New York

John K. Donohue, JD, MBA; Center on Policing, Rutgers University

John Hall, MPA, MS ; Crime Control Strategies, New York Metropolitan Transportation Authority Police Department

They lay out their issues with the paper in considerable detail in a paper of their own titled:

Registering a proposed business reduces police stops of innocent people? Reconsidering the effects of strip clubs on sex crimes found in Ciacci & Sviatschi’s study of New York City

which was published in Police Practice and Research, 2024-05-03.

This post is already quite long, so I am going to just give you the two most salient (in my opinion) points that are made by the skeptics in their paper.

First, as to the economists’ ‘sex crime’ data:

“The study uses New York City Police Department stop, question and frisk (SQF) report data to measure what it asserts are police-observed sex crimes, and uses changes in the frequency of the reports to assert the effect of opening an adult entertainment establishment on these sex crimes. These reports document forcible police stops of people based on less than probable cause, not crimes. Affirmatively referring to the SQF incidents included in the study as ‘sex crimes,’ which the paper does throughout (see p. 2 and p. 6, for example), is a category error. Over 94% of the analytic sample used in the study records a finding that there was insufficient cause to believe the person stopped had committed a crime….In other words, 94% of the reports are records of people who were legally innocent of the crime the police stopped them to investigate.”

And then, for the data on the openings of aees:

“This brings us back to using the date a business is registered with New York State as a proxy for its opening date, considering it provides a discrete date memorialized by a formal process between the government and a business. However, the date of registration is not an opening date, and has no predictable relationship to it, regardless of the type of business, or whether it requires the extra reviews necessary for a liquor license. New York City’s guidance to aspiring business owners reinforces the point that registration occurs well before opening.”

I close with the following. It turns out our four skeptics sent a comment to The Economic Journal laying out all their concerns about the original research, the Journal duly sent said commentary on to the authors, Ciacci and Sviatschi, and those authors responded that they did not think these concerns affected the important points in their paper. So, the journal not only did not retract the paper, it declined to publish a Commentary on its findings by the four skeptics. (Econ Journals do publish such Comments from time to time. Not this time.)

I mean, that would just make the original authors – and the Journal – look bad, no? The skeptics did, as we saw, eventually get their concerns into the public domain via a different publication – one read by pretty much nobody who reads The Economic Journal, I’m thinking.

Again – if it seems too good to be true…Objects in mirror may be smaller than they appear.

Debt, Taxes and Tails Wagging Dogs

A short, non-path-breaking post today –

I am more than old enough to remember when Canada’s GST was born, a great (or not) new source of revenue to fund government programs. A fact about Canada that it shares with the US but no European advanced economies is that Canada’s federal government gets almost exactly half of its revenues from the personal income tax. Same for the US, but the Europeans get much less than that, relying more on consumption taxes and VAT.

Well, the most recent Liberal government budget breaks some new ground, apparently. From The Hub –

For the first time in 12 years, government debt costs will surpass GST revenue

  • Projections from budget 2024 now show both revenues from the GST and public debt charges match each other at $54.1 billion.
  • The federal government could spend as much as $64 billion on charges for public debt by the end of the decade.
  • In future years, the government estimates GST revenues won’t cover its public debt charges. In 2028-29, the GST is projected to generate $61 billion in revenue. Meanwhile, public debt charges will reach $64 billion.

In case you’re not familiar with government-speak on budgets, ‘public debt charges’ refers to the amount the government pays out in interest on what it has previously borrowed. So, know that when you pay the GST on anything you buy, those dollars are going to people (or banks, more likely) who bought Canadian government bonds at some point in the past.

It is not at all fashionable in most Western countries these days to worry about government deficits. Government borrowing is thought to be a perfectly sensible means of providing important government programs that do good things for people. However, the above figures point out that there is one eventual consequence of this policy. Continuing deficits add to the total amount of government bonds outstanding, bonds which must be redeemed or rolled over down the road and the interest on them paid out, also using government funds. Thus, ‘servicing the public debt’ becomes a larger and larger line item in total government spending, until, as noted, one must raise increasing amounts of revenue (or further increase borrowing) in order to pay off the previous borrowing. Eventually the spending on servicing that debt can become the tail that wags the dog of government spending. It necessarily makes it harder to spend on other government programs.

Pipers must be paid, either with more borrowing, higher taxes, or reductions in other spending. …or, governments can always print money, but that’s a topic for another day.

It’s Getting Hot Out: The Efficacy of Heat Warnings


Summer’s about here, and we can look forward to more of that Environment Canada staple – The Heat Warning. You know, the alerts about high temps and humidity you see on your favourite source for weather info.

I never think much about them, figuring people are pretty good at understaning when it’s hot out and what to do about it. It turns out some local researchers got to wondering if these alerts did any measurable good.

Their work was written up in the Freeps some while back, in an article headlined:

Do hot-weather alerts help? No, not really: London researchers

– published on Aug 22, 2022.

The tag line below the title reads “Those heat alerts telling us to be careful when temperatures spike? Turns out they do little to keep people overcome by heat out of hospital, say London researchers calling for changes to make the warnings more effective.”

The Freeps reporter has the research right in this case. In the research article you will find the following two paragraphs –

“The researchers compiled data on patients with heat-related illnesses who showed up in emergency rooms from 2012-18 and looked at whether their numbers dropped after the harmonized heat warnings kicked in.”

Then later –

“While there did appear to be a slight drop in heat-related emergency room visits after the provincial warning system was introduced, particularly in children and adults with chronic conditions, the results were not statistically significant, Clemens said.”

I went and read the research paper, published in The Canadian Journal of Public Health in 2022 (I’m a geek; you can read it too, here, although you will have to get past the paywall). That is indeed what the researchers say in the paper.

This research paper strikes me as reporting on potentially useful research. The Freeps article notes that “In southern Ontario, heat alerts are issued amid daytime highs hit 31 C or higher, lows of 20 C or when the humidex reaches 40.” You want to put off digging that garden to another, cooler, day. Old coots like me are particularly aware of this.

But setting aside my own instincts, I am all in favor of research to determine whether government initiatives are having their hoped-for effect. My unease about the research arose from the following lines in the Freeps article, in which the lead researcher is quoted –

“This research points to the need to raise awareness of heat-related illness. I’d like to see this translate into more education and physician-level awareness . . . ,” Clemens said. “As an endocrinologist, (I) could help inform or prepare my complex patients to better protect themselves.”

Huh? Exactly how does this research point to that? These research findings say the current warning system had no impact on heat-related emergency-room visits. What is the logic leading from that useful finding to the first sentence in the quote above? And as to the second quoted sentence, by all means, go ahead and inform and prepare your patients, but what does “this research” have to do with that?

Then, at the very end of the paper, we find this:

What are the key implications for public health interventions, policy or practice?

  1. More heat alerts were triggered in Ontario between 2013 and 2018, and many cities spent more days under heat warnings. The implementation of a harmonized HWIS appeared to reduce rates of ED visits for heat-related illness in some subpopulations, but at a provincial level, the change was not statistically significant.


  1. Given HWPs are a main policy tool to protect populations against heat, we suggest ongoing efforts to support effective HWP in our communities, with a particular focus on at-risk groups.


The journal itself probably has a requirement – since it is a public health journal – to include in any published paper a final statement on the public health implications of the research. However, point 1 is not an implication of the research findings. It is just a restatement of the fact that the research found the warnings had no impact. However it is entirely misleading to say that the HWIS ‘appeared to reduce rates of ED visits…’ and then immediately say ‘the change was not statistically significant’. All social science research operates with the knowledge that there is a lot going on in the world that we can’t identify, or even know about, and so any difference we see in data (like differences in ER visits) might be due to random chance. Researcher can’t just say something ‘appeared’ to be different when in fact the difference was statistically insignificant.

So, why cling to the ‘ we found this, but it wasn’t significant’ language? Why not just say ‘we found no impact’? That is a useful thing to find, indeed, and researchers should expect to find exactly nothing much of the time. Finding nothing advances our knowledge about the world, it is very useful to learn ‘well, that doesn’t seem to have any impact’.

Then, in implication 2 above, they write “…we suggest ongoing efforts to support effective HWP in our communities….”

C’mon folks, you just found that HWPs are ineffective in reducing ER visits, so in what way is an implication of that finding that we should support effective HWPs? Particularly since nothing in your research tells anyone what an effective HWP might look like.

Having hung around with social science researchers nearly all my adult life, I will bravely put forward a hypothesis about motivations, here: there is nothing that would have induced the researchers to write, instead of the two misguided points above, this implication of their research: –

Our research suggests that the HWIS program and its associated HWPs be ended, and the resources involved be directed toward programs for which there is evidence of effectiveness.

That sentence never stood a chance of appearing in their paper.


That Unfriendly Law Thing

Over lunch one day, a friend of mine said to another friend of mine – ‘The law is not your friend’. I am not always in agreement with Friend 1, but in this case I could only say ‘Amen’.

But never mind what I say, the Globe and Mail featured a story on April 12 titled:

 ‘Foreign landlord fails to pay taxes, CRA goes after tenant’

that is eloquent as hell on this very topic.

The story is as appalling as it is instructive. A tenant in Montreal had a landlord who was an Italian resident for tax purposes, and that landlord did not pay the Canadian income taxes owed on the rents he received from said tenant. If ya earned it in Canada, ya gets taxed in Canada. The CRA, noble institution that it is, told the tenant he was on the hook for the unpaid taxes, because he was supposed to withhold 25% of his rent for that purpose. You know, just like you do when you pay those Swedes at Ikea for that sofa you purchased, or pay for that pack of Slim Jims at Mr Kim’s Convenience.

The tenant took the CRA to court over this – Tax Court, natch – and lost.

Here’s my favourite part. Really. Quoting directly from the Globe article, now –

The judge acknowledged “the harsh consequences,” in her decision, but still held the “resident payer,” or renter, liable.

The tenant’s lawyer pointed out that there was no reasonable way for the tenant to even know his landlord was not a Canadian resident for tax purposes. That, of course, was deemed to be no excuse.

My second favourite part is the last line of the G&M piece on this:

The CRA did not respond to requests to comment.

Really? No comment?

However, I am not kidding about my ‘favourite part’, as the judge’s attitude is a perfect illustration of The Central Fact about Large Bureaucratic Organizations (LBOs) – and our legal system is one Really Large BO. Those who are in such an org can always justify to themselves and to the world treating people in any way that is consistent with The Rules of the Org, however inhumane such treatment may be.

The judge could acknowledge harshness, could even shed a tear, perhaps, but, ya know – the law is the law. And, as my friend said, it is not your friend.


Attitudes on Peace, Order and Citizens’ Rights

At this point I have lived 63% of my life in Canada (nearly 81% of my adult life), but I was born in the US of A. It is common among my friends – wherever they were born – to argue about the differences, or lack thereof, between Americans and Canadians. Like all general comparisons, they are at best approximations, and not very precise ones, at that. Still, it’s a generally amusing exercise, and it gives us all something to argue about over beer.

However, sometimes things pop up on my radar that seem like they might reveal something useful about such differences. One example appeared in a letter to the Editor of the Globe and Mail just after the Federal court ruling that the Liberal Government of the time was not justified in invoking the Emergencies Act during the trucker convoy protest in Ottawa. It’s hardly surprising that this decision prompted a lot of folks to write to the G&M, but the letter below caught my attention –

Letter to the Editor, G&M print edition, Jan 25, 2024

Re: “Invoking Emergencies Act wasn’t justified and infringed on Charter rights, Federal Court rules” (Jan 24).

Really? What is wrong with this country?

We watched as a collection of bullies occupied Ottawa, breaking parking and noise bylaws and generally being inconsiderate to the local inhabitants. The federal government is now being censured for its decision, which solved the problem with no blood spilled.

We as polite Canadians seem to be at the mercy of individuals who claim that their right to cause mayhem trumps our right to peace, order and good government.

Signed, etc.

I immediately wrote a (sarcastic, I admit) reply to this letter and sent it to the G&M Editors, which of course they did not print. I mean, really – the three sins of the protesters you can name are breaking parking and noise by-laws and being inconsiderate, and that to you is sufficient grounds for the government to invoke the Emergencies Act and start demanding banks turn over account information? Really?

I suspect if you asked 100 Canadians and 100 Americans whether they agreed with the letter-writer’s position, you would get a higher percentage agreeing among the Canadians than among Americans, but I’m not confident that the difference would be all that large. My suspicion is that 21st-century citizens of all the advanced democracies are on average more concerned with peace and order than with any threat to their rights as citizens. That is, to be sure, no more than a hunch, based on being on the planet a long time. If anyone knows of good research on Can-Am differences in attitudes about such matters, I would love to get references.