Summer Jobs
The Free Press this week had an article – a memoir, actually – by one of its writers, recalling her youthful summer jobs, largely in the restaurant industry. She waxed on about what they had taught her about people and life, and I could only nod as I read. My first job at 15 at MacDonalds – which is sortof like a restaurant – as well as later ones delivering furniture and working in a couple of factories, had a lot to do with my growing up. Or so it seems here from the perspective of my 70s.
That article was titled ‘The Death of the Summer Job’, and one of its last sentences is ‘I’m sorry for the teens who won’t get these experiences.’
My impression is that teens working at summer jobs is indeed a disappearing phenomenon, but on the other hand, she also writes ‘A third of teens—roughly five to six million of them—will still find jobs this summer…’, referring, of course to the US.
This got me wondering, retired economist that I am – is the summer job truly disappearing?
As it happens, there had appeared an Opinion column in the WSJ previously in the week by another economist, one Roland Fryer, titled ‘Why Teenagers Stopped Working in the Summer’. It is teasingly subtitled ‘For the most part not because they couldn’t find work. They found better opportunities instead.’
Before I try to explain what Fryer lays out (it is a bit complicated) let me add a few details about the author. He is indeed an academic economist, with a position at Harvard, no less. That would often be enough for me to ignore him, but he is not your typical Harvard econ prof. For one thing he is black, which does not really make him unusual at Harvard of all places, but he is also what one might call a black sheep. In 2018 Harvard barred him from his own research lab due to accusations of sexual harassment. What really happened there? I cannot say. Fryer eventually published a public apology for having “allowed, encouraged and participated” in a collegial atmosphere at EdLabs that included “off-color jokes”, which makes it all seem like yet another tempest in a teapot. Yet, he was suspended without pay by Harvard for two years, before being allowed back on the faculty in 2021.
He also published a paper in 2019 in The Journal of Political Economy, one of my profession’s most esteemed outlets, concluding that although African Americans and Hispanics are more likely to experience police use of force than whites, they were not more likely to be shot by police than whites in any given interaction with police. This generated controversy, to be sure.
So, a black sheep in several senses, but he now writes occasional columns in the WSJ on economic issues, and this one caught my eye.
Here, as clearly as I can manage, seems to be the gist of what he asserts. The data is all from the US, as usual, and the unfortunate thing to me is that Fryer says nothing about from where any of this data comes. So, I can say nothing about its reliability. That said, I have no reason to doubt its accuracy.
First, he notes that on the surface, we have this –
The classic summer job has been disappearing for nearly half a century, ever since teen labor-force participation peaked at 57.9% in 1979.
I note in passing that all my summer jobs came before that, as did likely most of yours. I was finishing my PhD by ’79.
However, Fryer points out in this quote that it is more complicated than it seems.
The share of 16- to 19-year-olds holding a job has fallen by a third since 1979, from 48.5% to 31.1%. Yet the teenage unemployment rate—the share of teens looking for work who can’t find it—is lower today, at 14%, than the 16% registered in 1979.
To get what he is saying, you need to understand something fundamental about what is meant by ‘the unemployment rate’ in general. The rate mentioned above for teens of 14% means that 14% of teens who are looking for a job cannot find one.
This is key to Fryer’s article. Fewer teens are looking for jobs than did in the past. And he has a specific explanation for that, which goes like this.
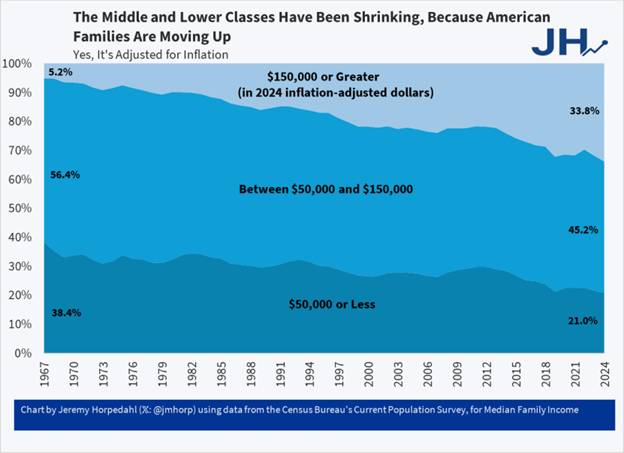
Imagine dividing teens into two groups. Those whose parents are relatively well off, and who are therefore likely to go to university, and those whose parents are of lesser means, and likely to enter the work force after high school.
Fryer says the first group is indeed unlikely to hold summer jobs these days, and the second group is likely to be looking for them, but less likely to find them. Why? Here is point one:
The wage premium a college degree brings roughly doubled between the late 1970s and 2000, from about 40% to nearly 80%. The hour a 16-year-old once spent folding shirts at the Gap now carries a much higher opportunity cost; spend it instead on anything that bends the arc toward college, and the lifetime payoff is significantly larger.
If you are someone who might go to university, it pays to spend your time in pursuits that will increase the probability you get into one, and the better the university you enter the better for you. Get SAT tutoring, go to science camp, do an unpaid internship to meet the right people. Thus, it is these relatively well-off kids who are no longer really interested in the classic ice-cream-shop summer job, and that is what is driving the fact that fewer teens are looking for summer jobs.
Point two. For the kids lower down the family socioeconomic ladder, that summer job in the ice cream shop still has all the value it did for people from my generation. Fryer writes that he worked bagging groceries in Lewisville, Texas at 15, and that the structure that job gave his life, along with the spare cash, were things a kid in his situation (abusive dad, absent mom) desperately needed. ‘That minimum-wage job might have been one of the most valuable things that ever happened to me.’
The only things those kids from the lower group have going for them these days is that they are competing with fewer teens from the upper group for the jobs that are still out there.
His bottom line:
The vanishing summer job is two experiences buried in one statistic. For most American teenagers, the decline is a rational bet on a future that rewards their time elsewhere. For the kid I once was, the same number means the opposite.
So, yes, says Fryer, the summer job as a life experience is disappearing, or at least shrinking, but the reason for and implications of that for young’ns depends on where on the socioeconomic ladder their family resides. That, he writes, is in itself concerning, as those lower-class kids are looking for summer jobs in an economy in which the number of such available is in fact shrinking. This is thanks in no small part to a rising minimum wage. That has led MacDonald’s and other such potential teen employers to find ways to do business with fewer teenagers and more machinery.
There is another aspect of the teenage job market about which Fryer says nothing, and on which I have only anecdotal evidence, largely gathered from people I know who own businesses in the restaurant and retail sectors. They tell me often that the teenagers (and twenty-somethings) they do hire are to a distressing extent overwhelmed by the requirements of retail and restaurant work. They are constantly off for reasons of ‘mental incapacity’ and show little initiative or industry when they do show up. One of the business owners I have talked with on this topic said to me that ‘None of these young people seem to be well-adjusted human beings.’
I leave those impressions – which is all they are – with you, as I seek to find more solid info about this.
Postscript
That original article mentioned above in The Free Press included a lot of commentary by readers, much of it nostalgic reminiscence about their own summer job experiences. However, I do find that Free Press reader comments are in general more articulate and wise than those in either the WSJ or NYT. Here is an excerpt from one such TFP comment that I think is very well put and right on the money –
When I was young, a summer job was a temporary arrangement whereby adults paid teenagers a modest sum to make mistakes with expensive equipment. This was considered educational. Today we have decided that education should occur only under the supervision of certified professionals armed with background checks, reflective vests, and a 47-page safety manual.
I can say only ‘Amen to that’.