Precise Bullshit
I write this blog in no small part because I believe something I used to tell my students: ‘Writing is thinking’. I know a lot of people watch or listen to podcasts, and good for them, you can probably learn a lot from them. My Wall Street Journal seems intent on turning itself into the YouTube of News, as its website features all kinds of videos. What I find disturbing is that the website does not allow you to ignore those videos. As I scroll down it automatically stops me when I get to a video, and then pushing the down key on my laptop starts the video playing. In other words, ‘Watch the goddam video!’
Instead, I stop the video and keep scrolling down to other articles I want to read. And, I cuss a lot. There is a long post on the blog Cultural Capital by James Marriot titled ‘The Dawn of the Post-literate Society’ if you want to get really depressed about the decline of reading and writing. I know I did. It’s free, and you can read it here.
Despite my belief as stated above, however, not everyone who writes a blog thinks very hard about what they write, sadly. Indeed, as I have pointed out elsewhere on this blog, not even the editorial board of The Wall Street Journal seems capable of thinking very hard about what they write, or understands the difference between information and bullshit.
In some recent meandering around the great WWW, I came across a blog post by one Ed West that made that point very clearly. West writes a blog called Wrong Side of History which is mostly behind a paywall, but whose freely available posts have in the past contained some interesting material. However, my willingness to believe anything he writes took a big hit when he wrote a free post called ‘The Mourning of the Elephants’ which you can read here.
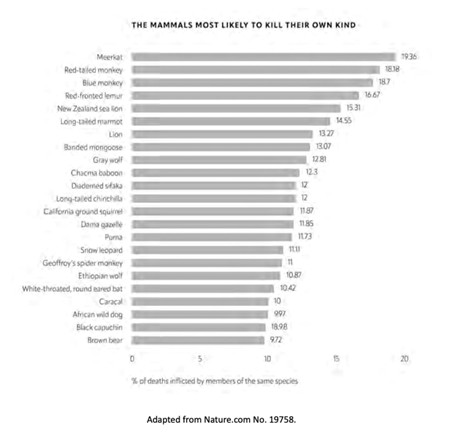
It included the statement ‘Humans, in contrast, do not even rank in the top 30 of species who kill their own kind, despite the toll of wars.’
West gives no source for this remarkable claim, but includes the graphic below. It is not very legible in his post, either, and there’s nothing I can do about that, unfortunately. You can make out the numbers in it, however.
Before I say more, let me note that I took that line at the bottom of the graphic to heart, and went to the website of Nature, which is a high-visibility scientific journal, and tried to use that number 19758 to find the source of this graph. I got nowhere. I put that number into the search box, nothing. I tried various keywords like species killing and such, but nothing resembling this graph could be found, and keep in mind that I also could look through articles in Nature itself due to my faculty status at the university library. I got nowhere, so I have no idea where this graph comes from, or what ‘adapted from’ means in that caption.
Let us nonetheless see what the graph is trying to tell us. It is the foundation for West’s quote above, as it seems to rank the 30 (mammal) species in which the deaths that were caused by being killed by another member of the same species were highest. Humans, who are definitely mammals, apparently don’t rank that high. In other words, there are at least 30 other mammal species in which murder is a more frequent cause of death than it is among humans.
Here is the thing. Where in the hell does this data come from? How can anyone claim to know that 10.48% of all deaths of ‘white throated round-eared bats’ were due to murder? How was that data gathered? I am sure highly reliable data exists on the percentage of human deaths that are due to murder, at least in advanced countries like Canada and the US. That is because those countries keep track of all deaths, and when a death is at all suspicious a trained coroner comes in and determines whether it should be classified as a murder.
There are plenty of less developed countries in the world where any such data would be rather questionable, as it takes a lot of administrative machinery to keep track of all this. In some countries, when someone dies out in the hinterland, they are quietly buried and no report is made to any central authority. So, I say again, how does anyone come up with a number for meerkat murders? And note that the chart does not say it is believed that ‘somewhere between 15 and 23 percent of all meerkat deaths are due to murder’. No, no, it says that ’19.36% of all meerkat deaths are due to murder’.
Precision out to two decimal places!! What amazing exactitude! What bullshit!
Mr. West put this graph in his post because he could tell an interesting story with it. That the story is very possibly false is no matter, it is interesting. Sadly, and more worryingly, many social scientists take the same attitude to the data they use.
Addendum: Wait! Wait!
I have trouble leaving things alone, and the source of that graph above kept bothering me. And I found it! Well, sort of. I found Nature 19758. That is in fact the ‘title’ given to the pdf of an article in nature titled ‘The phylogenetic roots of human lethal violence’, which is a 10-page ‘letter’ published in Nature in 2016. Now, that graph above does not appear in said letter, but the authors do have things to say about ‘conspecific violence’ in different mammal species. It is part of the data they used for their statistical analysis. Here is what they say in the ‘Methods’ section of their letter:
Lethal aggression in mammals. To estimate lethal aggression in mammals (defined as the percentage of deaths caused by conspecifics) we compiled a database including the amount of conspecific killing observed in many species of mammals.
Um…..’many’? How many? A lot:
We found information about more than four million deaths in the 1,024 mammal
species (~ 20% of the total species) from 137 families (~ 80% of total families) and
the three main extant mammalian clades.
So, I went to that is called the ‘Supplementary Information’ for this letter to see what I could learn about this data on ‘conspecific violence’ in mammal species. Said information comprises some 168 pages. Jeeeezus. But hey, I’m a geek, so I found my way to the section on p. ??? (there is no page numbering) marked Data on Lethal Aggression in Mammals.
There is, indeed, a list of many many mammals by their latin names, and source codes (which I did not dig into) that indicates the reference from which data on that mammal came from. For each species they also give the number of deaths of that mammal that were observed, and the percentage of those deaths that were ‘conspecific’. At last we have a source from which the table above could be constructed. I can only guess that is what West or someone did. However, it is notable that the three authors of this article in Nature do not attempt to construct such a table of ‘most’ (or least) lethal mammals.
The data they have is, to put it mildly, highly varied. Some examples:
For species acomis cohirinus some 57 deaths were recorded in two different studies (don’t know if 57 is a total or an average) and 1.75% were ruled as conspecific. Don’t know what were the criteria for that ruling.
For species axis kuhli only 5 deaths by one study, none ruled conspecific.
For species axis axis on the other hand, some 8,317 deaths, 0% conspecific, in 15 different studies.
Are we starting to get the picture here?
For species canis simensis there were 46 observed deaths with a whopping 10.87% said to be conspecific, in exactly one study.
It is simply not good science, or good data analysis, to try to compare numbers that have been arrived at in many different ways, sometimes in multitudes of studies, sometimes in one, and with what had to be very different ways of determining the ‘conspecifity’ of a mammal death. The data on conspecific violence in any one of the studies cited would need to be taken with many grains of salt. No mammal species can possibly be observed in total. The meerkat, to cite one supposedly violent example, has a habitat that includes most of Botswana, Namibia and South Africa in southern Africa – around a million square miles by my reckoning. To observe anything about such a species without spending infinite amounts of cash, one sets up some kind of observation protocol in some particular area for some period of time, records what one finds, and then hopes that data is representative of the entire habitat at all times. In cases where several distinct studies were done for a single species, if the results were consistent with one another, that would be reassuring. If they are not, what does one do?
I stick to my adjective: 19.36% is bullshit.