The Great Alabama/Canada Battle: Round 1
I haven’t written anything geeky in a while, and this article was prompted by a non-geeky article in the Friday Globe titled
How Canada became poorer than Alabama
That sounds just wrong, doesn’t it? I mean, the very idea that Canada is ‘poorer’ than Alabama.
So, let me get the easy part out of the way first. What the article means by that ‘poorer’ adjective comes from comparing the GDP per capita of Alabama to that of Canada. To quote from the article itself:
After adjusting for foreign exchange and some cost differences in both countries, the average for Canada’s 10 provinces was estimated at US$55,000 in 2022, the same as Alabama. Shortly after, the IMF found Canada had actually fallen behind the southern state.
If you click on the link in that quote above, it will take you to an article in The Hub, about these numbers.
The Globe article in itself is said to be an ‘In Depth’ one. It’s quite long, and the writer actually went to Huntsville, Alabama, so you know they put some resources into this.
What I want to do here is just suggest a couple of better ways to compare the typical economic situation of someone in Alabama to someone in Canada (which is, by the way, muuuuch bigger and more diverse in climate and geography than Alabama).
Yes, economic prospects are not the only thing that matters to people, but let us just focus on those for this discussion.
First, what is this GDP/cap number anyway? The article says this:
To measure this, they calculated gross domestic product (GDP) per capita. In simple terms, it’s the size of the Canadian economy in a given year divided by the population. The same was done for Alabama.
Ah, jeez. Typical G&M. That’s not ‘in simple terms’, it’s confusing. ‘size’? How does one measure the ‘size’ of an economy? Is that in square inches or square kilometres?
So….GDP is a calculation of the dollar value of everything produced in a country (or state) in one year. Then you divide that dollar amount by the population. So, it gives you the dollar amount produced per person.
Is a comparison of those numbers for Canada and Alabama a useful thing to do to determine which place is ‘poorer’?
It’s not useless, but there are certainly issues.
If some company produces $1million worth of stuff in a year and sells it, then that money is used to pay out profits to shareholders and wages to workers and to pay suppliers, who in turn use that money to pay their shareholders and workers. Fine, but – even if the company is in Alabama, some of those shareholders are almost certainly not in Alabama. Same with the suppliers. So, $1million in sales by an Alabama company does not necessarily translate into $1million of income to Alabamans.
Presumably, if you want to do a ‘poorness’ comparison, you want to compare incomes in the two places, and GDP doesn’t quite do that. GDP tells you how much income is being generated per Alabaman, but not how much is being earned. If you are deciding where you would rather live (unlikely, I know) it is what you might earn that matters to you.
But, stats are available on incomes in these places, too. However, I am going to here suggest that we do not really want to compare income per capita (that is, average income) in the two places. Average income in two places can be the same yet it might be very differently spread around. To ease that problem a bit, I suggest we try to find out how median incomes compare in the two places. The median income for a jurisdiction is the income such that half the income earners earn more than that, and half earn less. Thus, it gives you some information about how incomes are distributed to all individuals. Not a lot, to be sure, for that you want to see the entire income distribution for Alabama or Canada, but that is complex to compare. We’re trying to keep things fairly simple here. [I’ve put in an example at the end of this post for those not familiar already with median vs average.]
Comparing earned incomes has its own issues. Like with GDP, you have to adjust for the exchange rates, but beyond that, income data is typically gathered in a number of different ways. Income per earner and income per household are the two biggies, with the latter including all the incomes earned by anyone in a household. Ya gotta compare apples to apples to learn anything.
So, I went looking, and as usual, finding what I wanted for Alabama was easy, as it is in the US, and that country is full of orgs that work hard at compiling and displaying such data. Canada is always tougher.
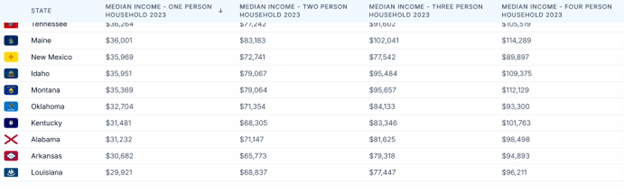
Below, first, is data I took from a site called World Population Review, which says the original data comes from the Current Population Survey, which is administered by the US Census Bureau. Below I only present the data for a selection of US states that includes Alabama. As you can see, they give different numbers for different size households. In 2023, for a two-person household they say the median income is $71,147.
Median income in US states, selection, 2023
In Canada, StatsCan does not gather or display the data in the same way. This makes comparisons tricky. Canada uses the concept of ‘economic family’, which includes singles living alone as well as households of various sizes. They do say the following –
According to StatsCan: Median market income for Canadian families and unattached individuals was $68,700 in 2023, a 1.5% increase from $67,700 in 2022.
Of course, that is in $C, and so the 68.7k is notably less than the $US71k for Alabama, for a household of two people, which seems to be as close as we can get to the Canadian ‘family’ concept. Ideally, one wants to use a ‘purchasing power parity’ exchange rate to ‘accurately’ compare these numbers, but I am not going to go there. I think what I show below is more revealing.
A factor which the G&M article mentions in passing is history. Whatever might be the exact comparison between Canada and Alabama right now, what do these two places histories’ look like, and how do they compare?
I did some more digging, and below is a graph from the always reliable St Louis Federal Reserve:
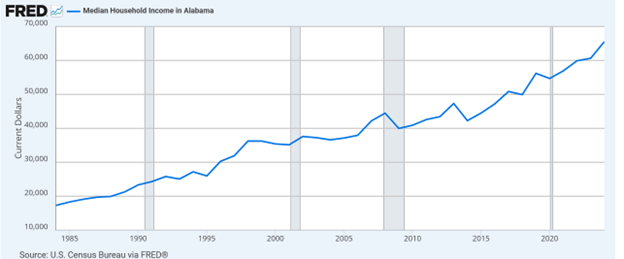
This depicts the median household income in Alabama from 1985 to 2024 in constant 2025 dollars, meaning with inflation taken out. It is a notable path, starting at around $17k way back when, and hitting $65,560 in 2024.
Here is a roughly comparable graph for Canada as a whole: (this is in constant dollars, but I can’t tell which year)
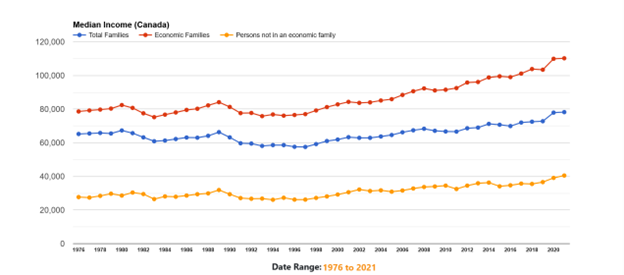
The graph we want to look at is the blue one, which is for all families, since the FRED data is for ‘households’. The time frame is a bit different, starting back in 1976 and ending in 2021, again in constant dollars. The median in 1976 was $65,200 and in 2021 it hit $78,200. Once again we have a currency rate to consider, but let’s just ignore that, and ask ourselves the following – in their own currencies, with inflation factored out of both, how have median incomes changed over this time in Alabama and Canada?
A quick use of the calculator (yes, I still have one) tells us that the real median income in Alabama increased by some 380% over 40years, whereas in Canada it increased by some 20% over 45 years.
Now, it is a matter of arithmetic that it is easier to get big percentage increases in something when you start from a low number, as is true for Alabama. Still, that comparison is so one-sided that, independent of exchange rates and all the other things that happened over that long time horizon, it does answer one of the questions in the G$M article; what happened? On purely economic grounds the economic case for moving from Canada to Alabama in, say, 1980, would have been hard to make. In 2025, it’s a very close call. What happened is that Canada chugged along in a perfectly acceptable fashion, while Alabama just took off.
Now, the hard question, as always, is why did that happen? That it did is hard to argue against.
Appendix: Mean vs Median
Imagine a very small place with 5 people in it, all earning income. The four poorest folks earn annual incomes of $10k, $15k,$25 and $30k per year. The one rich guy earns $100k per year. So, total income earned is $180k/year, and the average, or mean annual income is $36k.
However, the median annual income is only $25k/year.
And, more importantly, if the rich guy’s income doubled to $200k/year while everyone else’s stayed the same, the mean income would go up to $56k/year (280/5) whereas the median income would stay at $25k.