Education Outcomes and Inputs in Canada and the US
This is going to be a post without a strong message, prompted by a graph that I happened on while looking into something completely unrelated. The graph is below, and it shows changes in spending per pupil in the US state of Oregon, along with changes in the NAEP scores Oregon students earned in Reading and Math, all between 2013 and 2024. NAEP stands for National Assessment of Educational Progress, which is a set of tests given typically to grade 4 and 8 students in the US. NAEP is administered by a section of the US federal Department of Education. I am showing the Oregon results only because they are what I stumbled across. One can go to the website and see results for all other states too, but if you are so interested, I would suggest you go here instead.
Edunomicslab.org is a website of the McCourt School of Public Policy at Georgetown University, devoted to education finance, and it is the org that produced the graph below, using the stats provided by the Department of Education. It is simply more reader-friendly and organized than the US gov website.
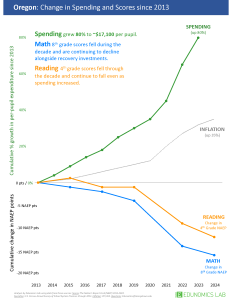
Again, not to pick on Oregon, you can find a similar graph for each of the US states, my quick perusal said that Oregon is not atypical. Spending on education has increased at a rate much greater than inflation in Oregon, at the same time that NAEP scores have decreased.
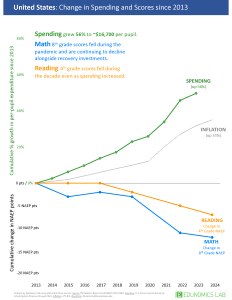
Below is the same graph for the US as a whole, which certainly indicates that most US states look like Oregon, since the national graph does.
Finally, here is another graph from the same source, which compares staffing on a national basis to student numbers.
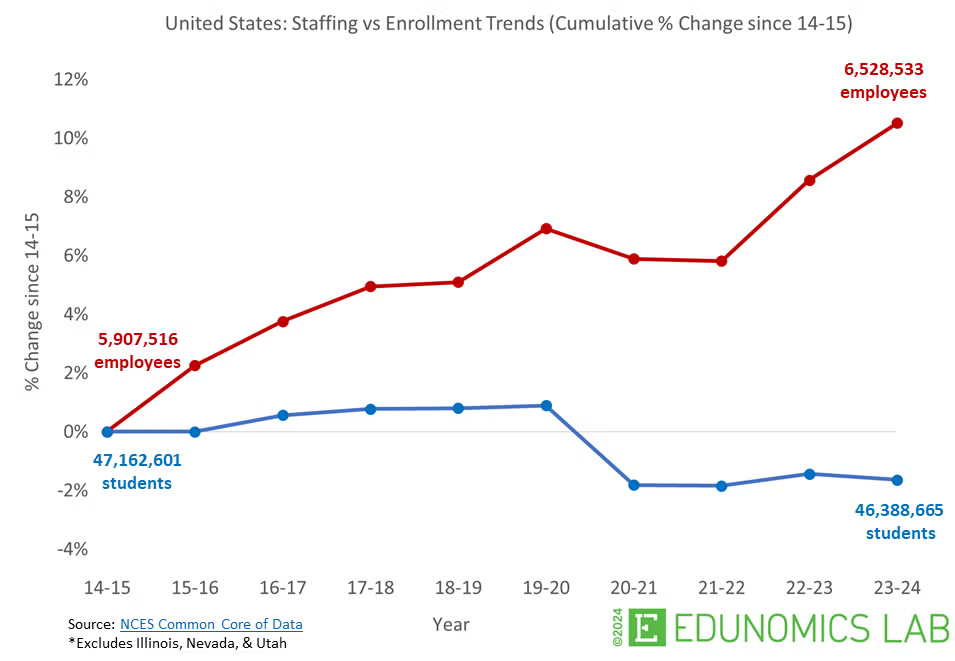
So, to note the obvious, staffing in US elementary schools has increased by close to 12% over this 10-year period, while the number of students has decreased by 2%. The graph does not indicate, and I could not find, any stats telling us how many of those added staff actually work in classrooms, rather than in the bureaucracy. I know what I would bet on in that regard, but cannot find corroboration, so far.
Anyway, the aggregate message here is clear. Over the covered period, US primary education has seen spending increase at a rate much greater than inflation, while also seeing staffing increase while student numbers fell (a primary reason for the spending increase, one must think) all resulting in worse student NAEP outcomes. It says nothing good about the current state of (largely publicly funded and administered) primary education in the US. I hasten to add, as does Edunomicslab, that there are US states in which the picture is better, in that student NAEP outcomes have gotten at least a bit better over this period. Their takeaway from that is that what states do with regard to education can make a difference.
I am not going to dive into state-by-state comparisons, I don’t live in the US. I am interested in how things look along these same dimensions in Canada, and here I run into the usual problem. No org in Canada does anything like the data gathering and organization of important public stats that you find in the US. StatsCan in the early years of my professional life had a reputation as one of the best such orgs on the planet. No more. Getting things from their website is difficult, they no longer produce user-friendly graphs and tables of such things, and on top of that, Canada does not have the same density of non-profit think tanks and such which take up the slack. The one exception to that latter statement that I know about is The Fraser Institute, whose efforts are none the less dwarfed by what is done by edunomicslab, among others.
My complaining aside, I did what I could to find something comparable for Canada, and succeeded partially, with the results below.
A Fraser Institute Report from August of 2024 provides the following stats, among others:
– Per-student spending adjusted for inflation (price changes) increased by 5.1% nationally from 2012/13 to 2021/22.
– Student enrolment across Canada increased by an average of 5.1% from 2012/13 to 2021/22. Three provinces saw a decrease in enrolment: Newfoundland & Labrador (5.8%), New Brunswick (1.8%), and Ontario (0.1%).
– Compensation remains the largest and costliest aspect of education spending and has contributed the largest portion to the growth of total education spending in Canada.
The time period here is close to the one in the US graphs above, but it aggregates primary and secondary school stats together. I could not find any stats on staffing level changes in Canada.
Canada has a variety of provincial testing regimes for its students, but what I found readily available were results on the PISA scores in Canada. PISA is the Program for International Student Assessment (PISA), a triennial survey run by the Organization for Economic Cooperation and Development (OECD) that assesses 15-year-olds’ abilities in reading, mathematics, and science. Thus, it is given to secondary students every three years in most countries. I don’t know what percentage of students in every country take it, but get the impression that it is high. It has the advantage of making Canada US comparisons easy, and the last round of PISA test was done in 2022.
I found the following:
Average mathematics scores have dropped consistently in Canada, from an average of 532 in 2003 to an average of 497 in 2022.
PISA reading scores in Canada went from 520 in 2018 to 507 in 2022, just four years.
PISA science scores in Canada went from 528 in 2015 to 515 in 2022
The Canadian average scores in 2022 in Math and Science were notably better than for the US, the reading scores in the two countries were almost the same. It is worth mentioning that Canada’s average score over the three areas was the eighth highest of all countries in 2022, while the US’s average ranked it eighteenth.
So my take, based on this admittedly non-optimal data, is that the situation in the two countries is similar, but rather more stark in the US than in Canada. Neither country’s educational systems are performing well in producing student outcomes from the resources they use in the sense that outcomes have been getting worse while spending and staffing have increased. No doubt some of the declines in achievement can be attributed to school lockdowns during the Covid era, but they started before that, so that is not the entire story.
None of this points clearly at what to do about any of this, the data is too aggregate for that. However, if more is being spent per student to hire more personnel per student, and outcomes are getting worse, I don’t see any way to avoid the implication that the increased spending and personnel are being badly deployed.