Why is Al Writing About Climate Change?
Quick answer – I was getting sick of politics and politicians.
Admittedly, I also came across some interesting things on a very good website I visit occasionally, Watt’s Up With That? You can read it too, at https://wattsupwiththat.com/ and it’s quite free.
And, full disclosure, I had first tried to lift the depression induced by reading about politics by reading about academic fraud. Didn’t work, don’t know why not.
Anyway, this is actually mostly about weather, and everyone likes talking about that.
So, a few items of interest (I think) from Watts Up.
1. A recent and most-read post on the site is very short and titled ‘Michael E. Mann’s Forecast Fiasco’. Mann is the fellow who way back in 2001 made famous – or perhaps infamous – the ‘hockey stick graph’ purporting to show the very recent and very dramatic increase in global temperatures relative to the last thousand-plus years. It created a lot of controversy at the time, still not resolved (although you wouldn’t know that reading Wikipedia’s entry on Mann).
Anyway, Mann, who is a prof at U Penn in Philadelphia, sent out a tweet last April predicting a ‘record-breaking 33 named storms for the North Atlantic hurricane season.’
Now, before I give you the punch line, let me just say that no one claiming to be a serious scientist should ever write something as stupid as that. I don’t know how anyone who understands even a little about statistics or weather or bloody anything thinks that they can predict a number that specific. And, not about something moderately predictable even, but about weather fergodsakes.
Well, reality eventually happened and there were 18 named storms this past season. 4 more than the average. Definitely not record-breaking. Definitely not 33.
I no more believe this will stop Mann from making future predictions about weather than I believe that ‘The President Whisperer’ will shut up after predicting a Harris electoral triumph in November.
2. Sticking with storms, what about all those scary tornadoes? There’s an article about this, too. Note that this is all about the US, but that country is the world leader in tornadoes, after all. A first quote from the article:
“While there have been no long-term trends in the frequency of tornadoes, there have been changes in tornado patterns in recent years. Research has shown that there are fewer days with at least one tornado but more days with over thirty, even as the total number of tornadoes per year has remained relatively stable. In other words, tornado events are becoming more clustered.
There is also evidence to suggest that tornado patterns have shifted geographically. The number of tornadoes in the states that make up Tornado Alley are falling, while tornado events have been on the rise in the states of Mississippi, Alabama, Arkansas, Missouri, Illinois, Indiana, Tennessee, and Kentucky.”
That quote is from an article in National Geographic, by the way, hardly a bastion of climate-change denial. Here’s another quote:
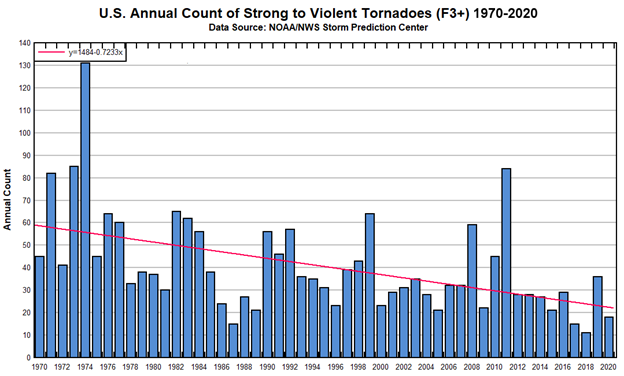
“There is no real evidence that tornadoes are happening more often. A lot more are being recorded now than in 1950, but a closer look at the data shows the increase is only in the weakest category, EF0. There’s been no increase in stronger twisters, and maybe even a slight decrease in EF4s and EF5s.
That suggests we’re just spotting more of the weak and short-lived tornadoes than we did back when the country was emptier (the United States population in 1950 was less than half what it is now), we didn’t have Doppler radar, and Oklahoma highways weren’t jammed with storm-chasers.”
We can be sure that the next time a tornado happens here in Ontario, that is not the story we will hear from whatever academic or Environment Canada type they interview about it. And, we can also be sure that a team of investigators will have to be sent out first to verify that whatever happened was actually a tornado. That doesn’t happen in Oklahoma. EF0 here, mostly. You don’t quite need a microscope to see ’em, but….
And, here’s a graph from the WUWT article to illustrate that last point (I like graphs….):

3. Back to hurricanes
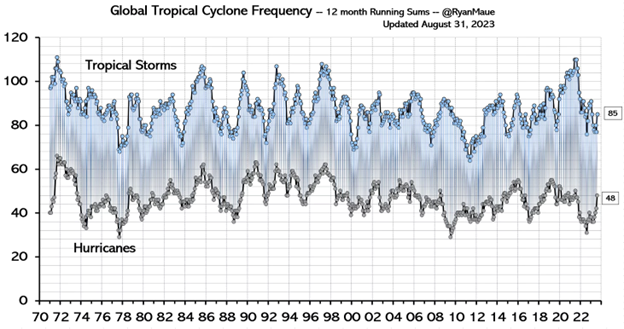
There’s a full article about these storms, also, and despite living in an all-but-hurricane-free part of the world, we hear about them in the media every season. Their paths are tracked on the news, even though said paths are thousands of miles away, and the papers are full of stories of damage, death and apocalypse. Well, here’s another graph showing the global frequency of tropical storms and hurricanes since 1970.

The obvious thing to see here is that there is no upward trend since 1970, but the other thing you might think a supposed scientist like Mann would notice is how bloody variable is the number of these storms from year-to-year. I’d expect that would dissuade anyone from thinking they can hope to accurately predict the number that will occur in a coming season. At least, anyone who’s not a tool.
4. I do recommend the website, it’s a bit geeky but highly sane.